Seven Numbers

One number per day, one poster per number

7 Numbers in 7 Days

For the next 7 days you will create one poster a day.

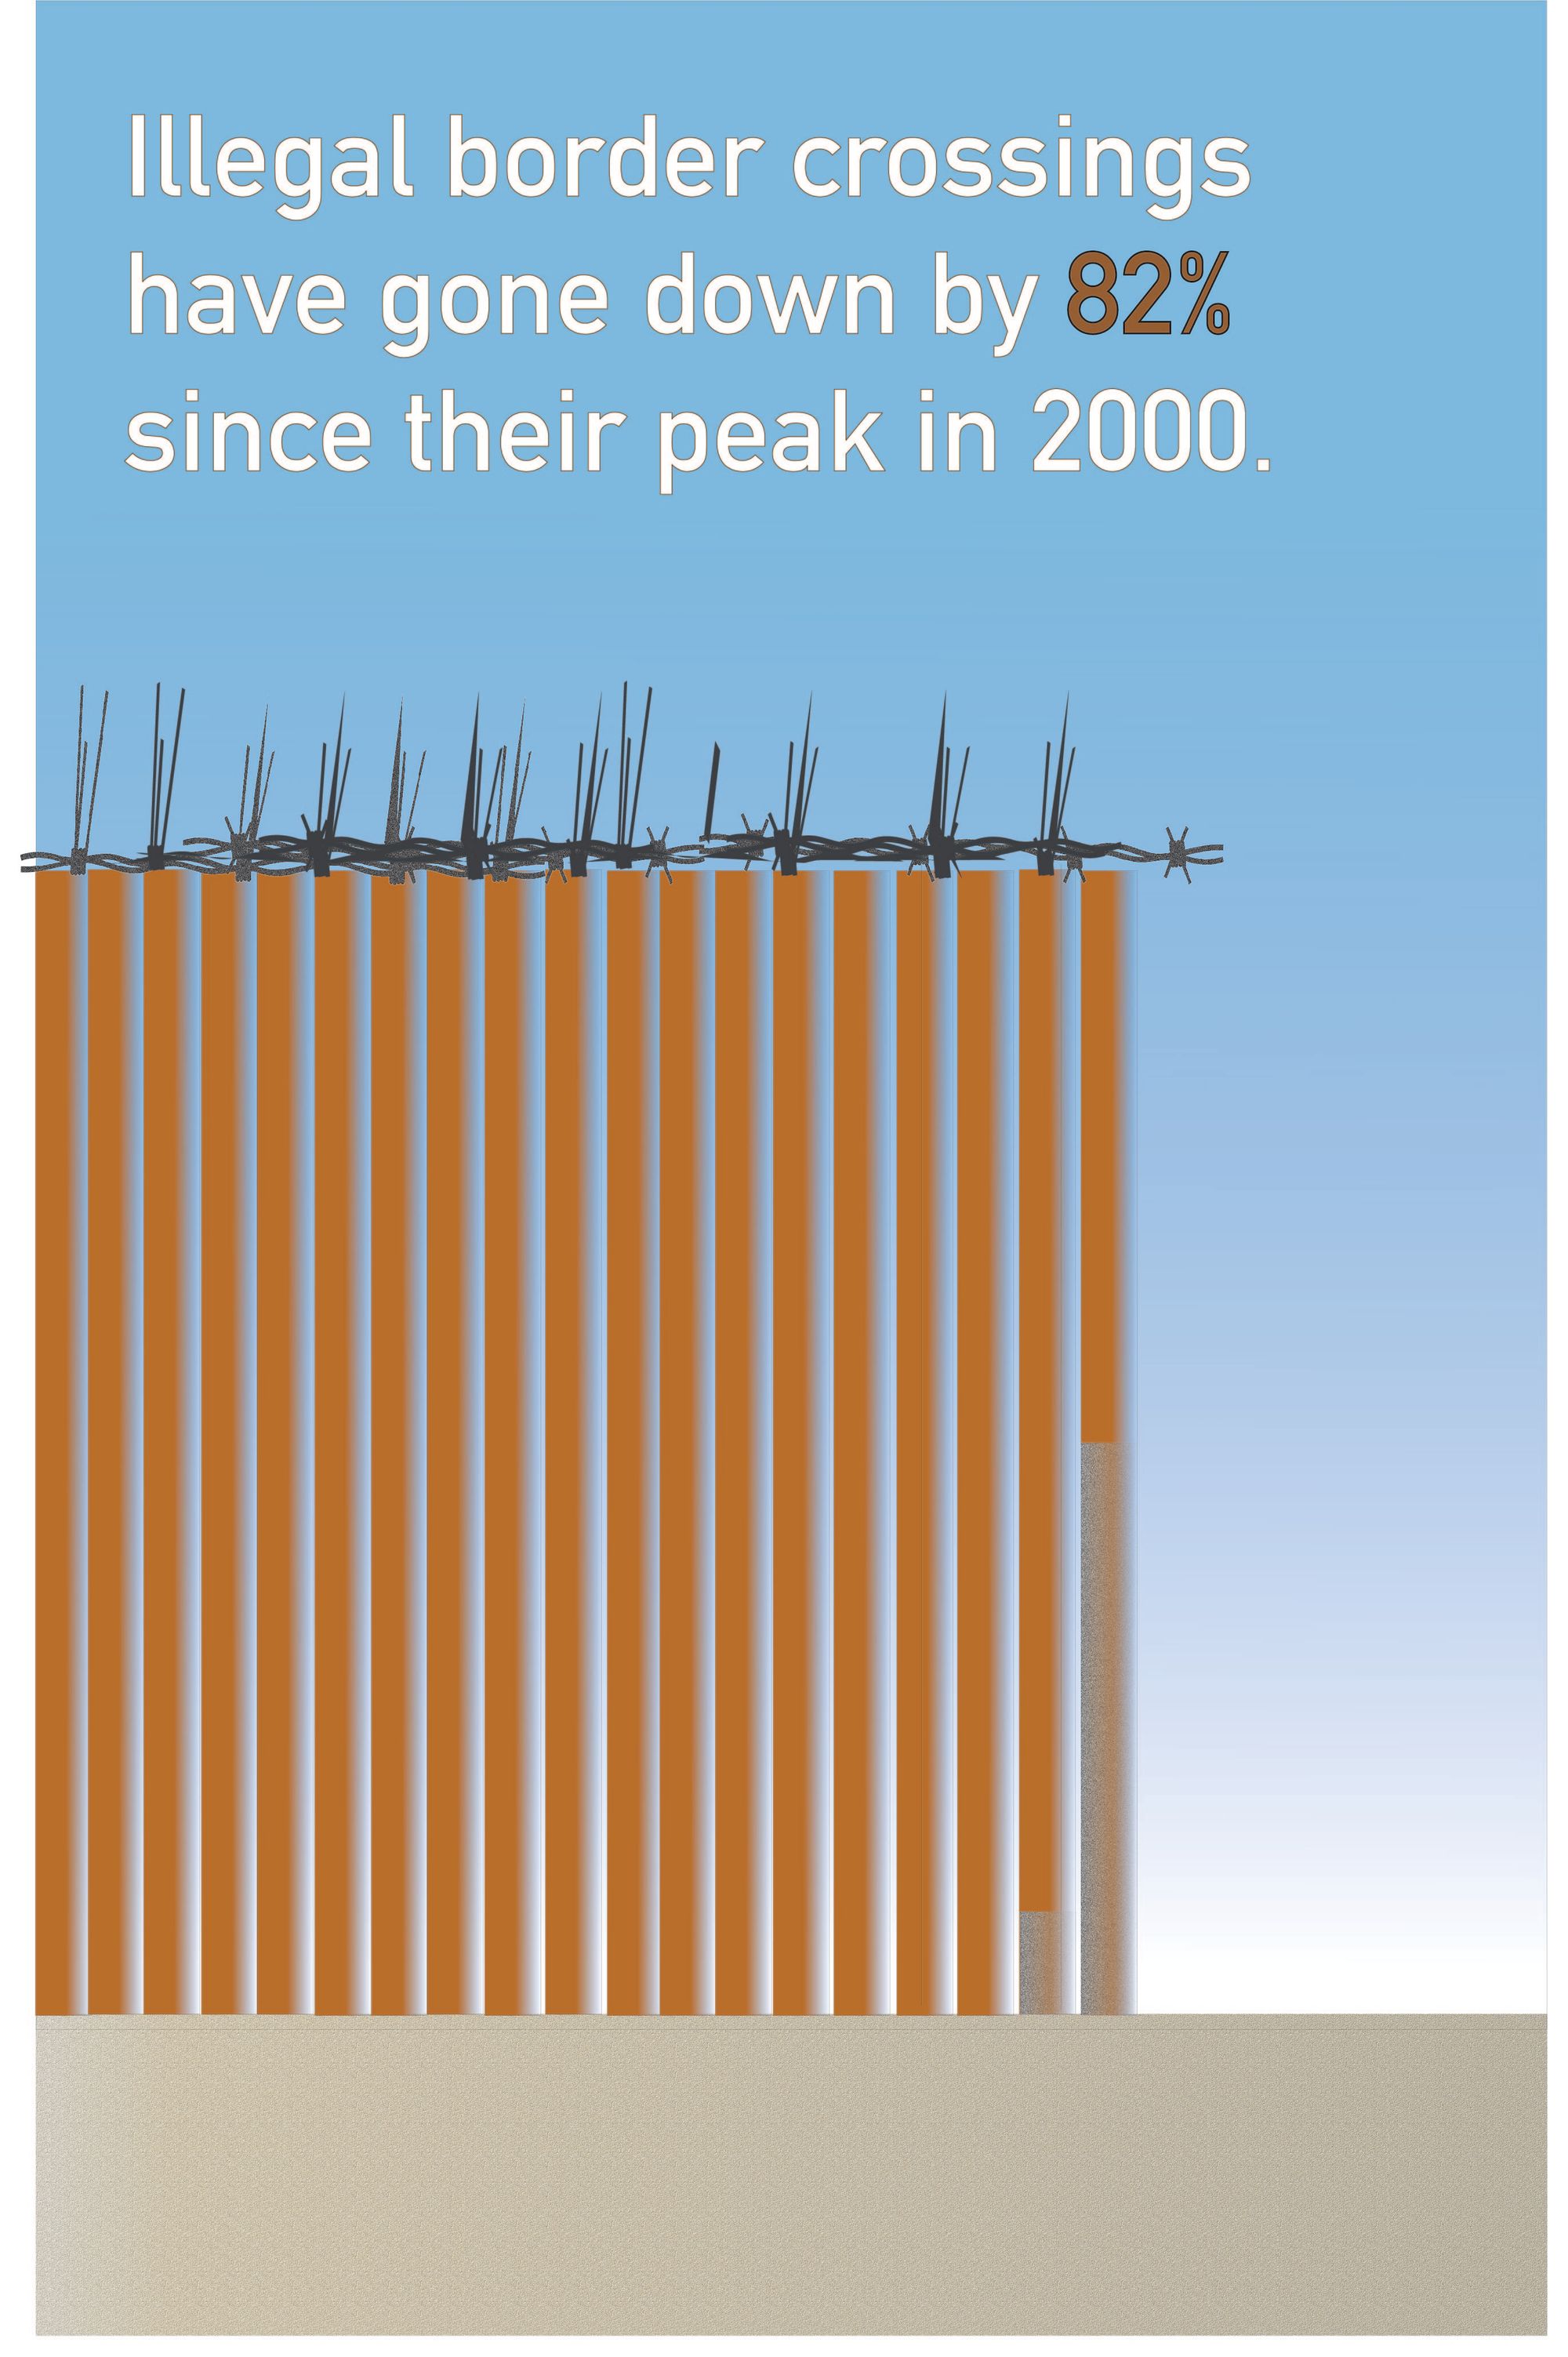
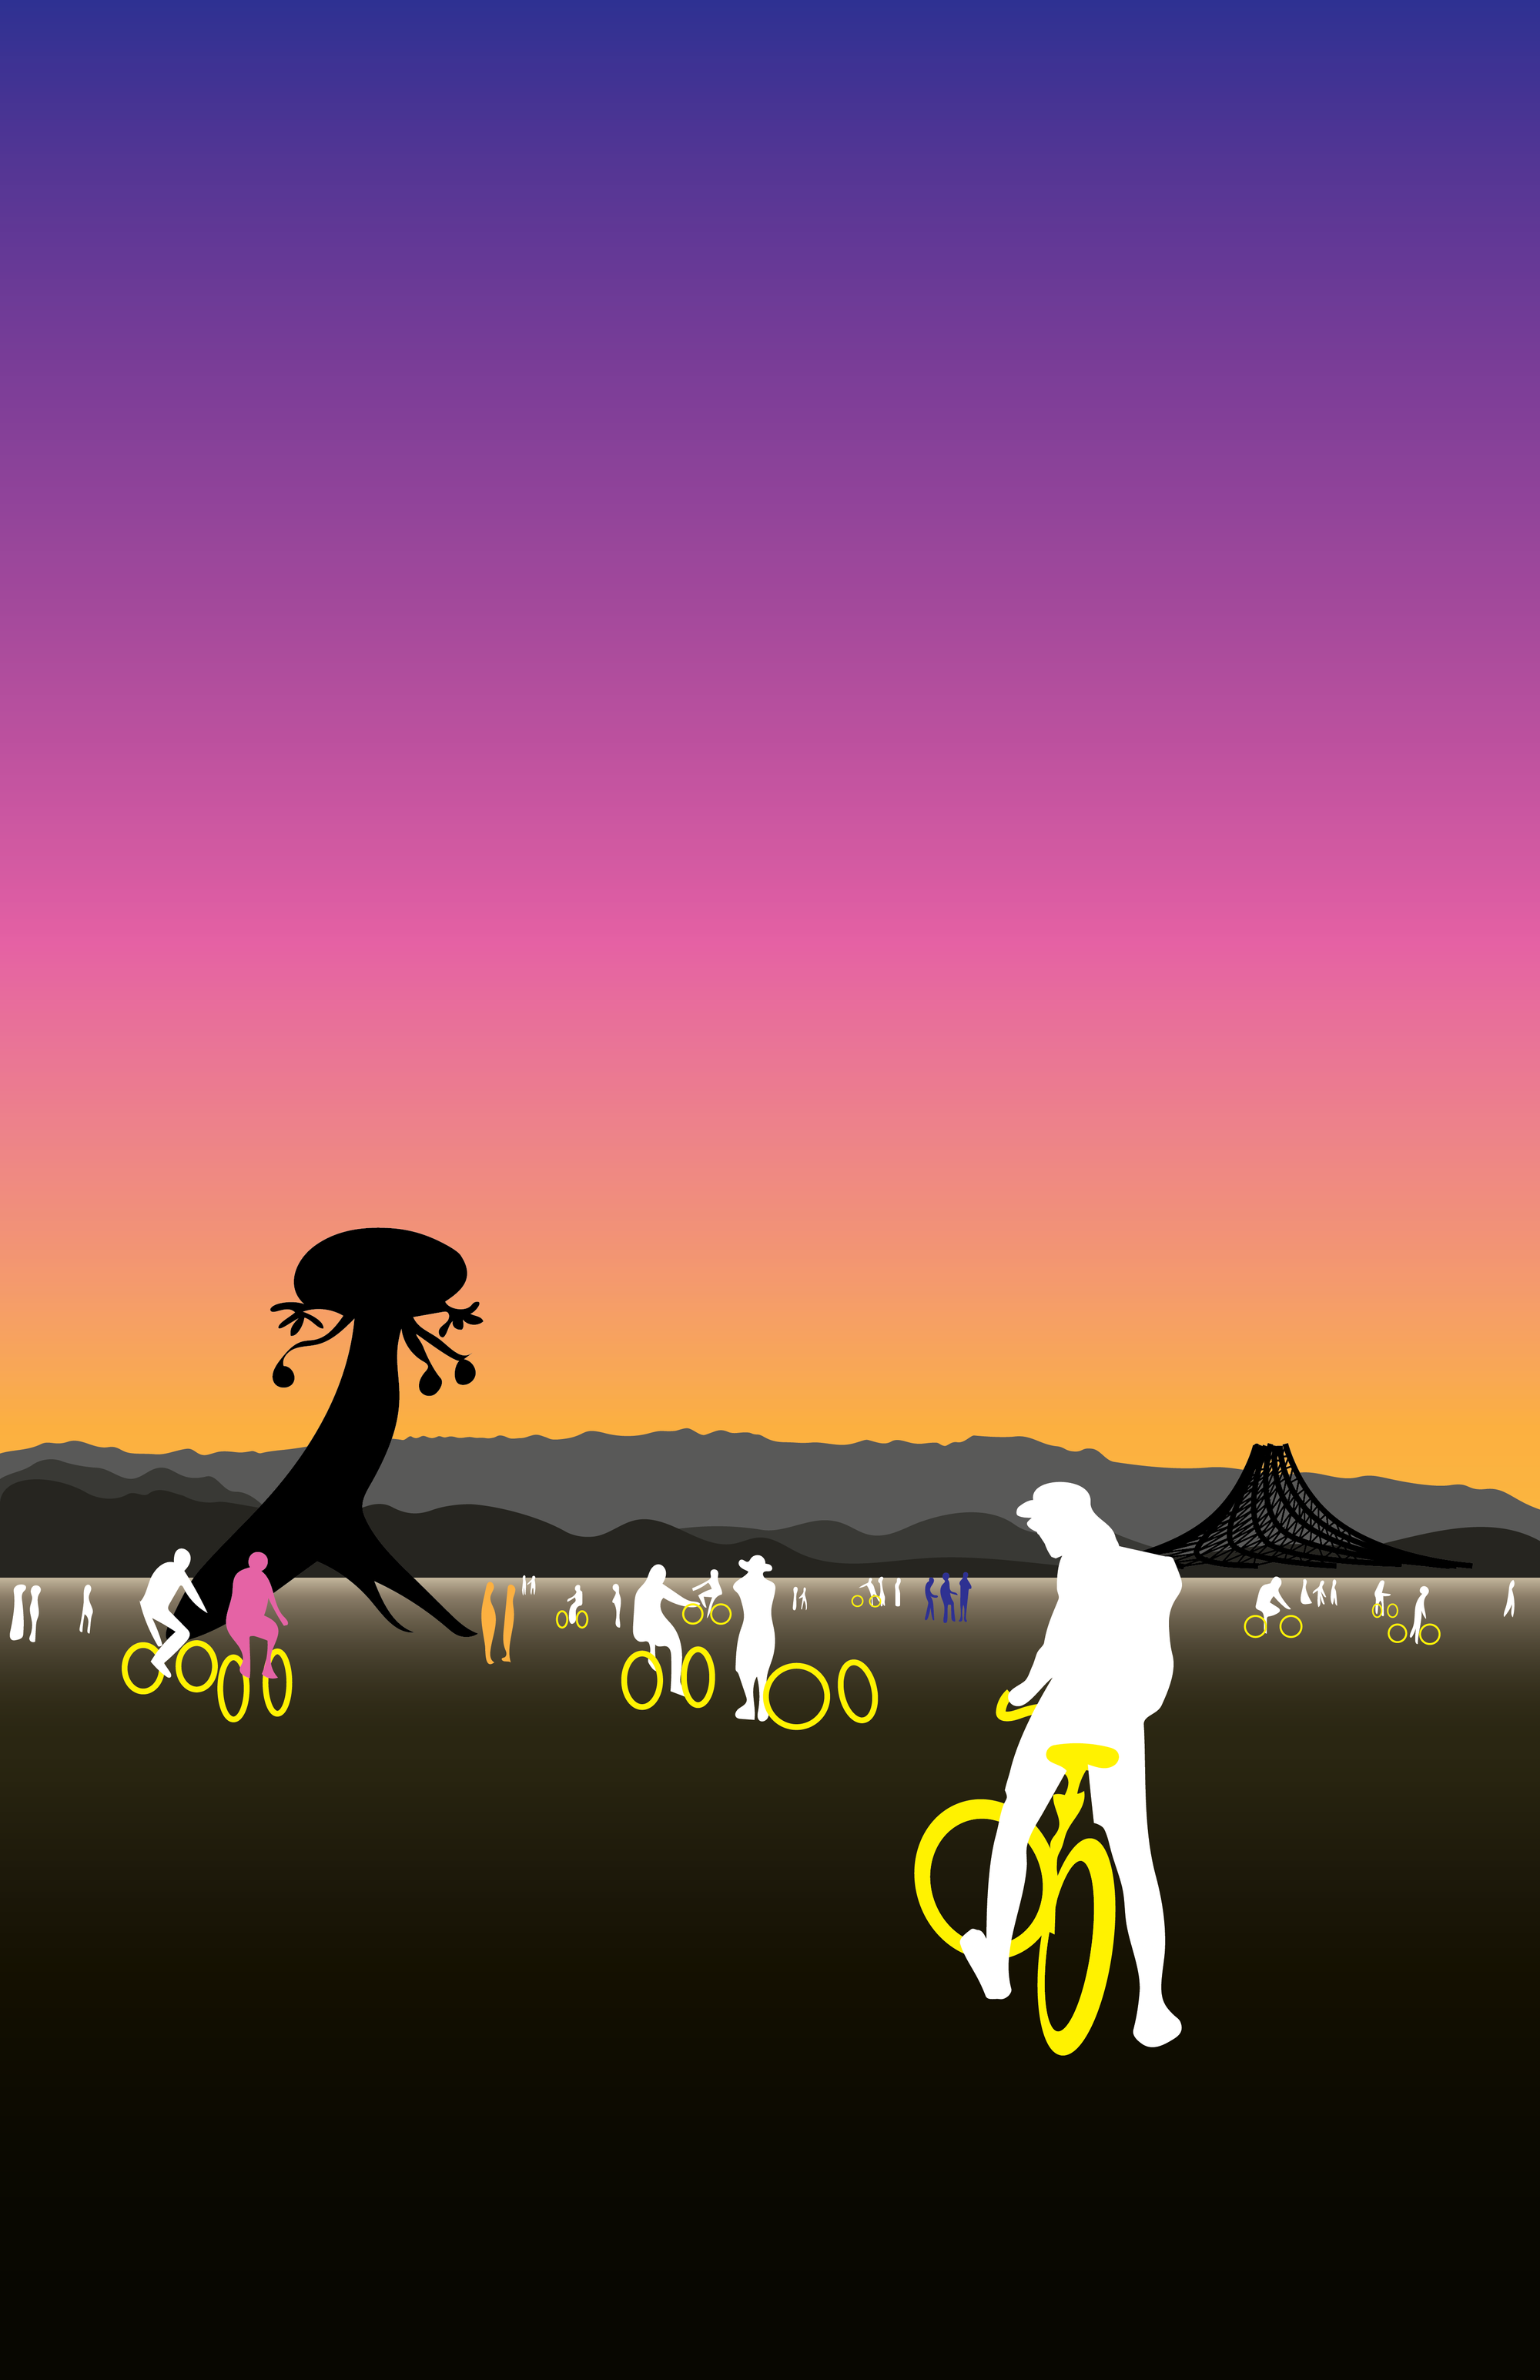
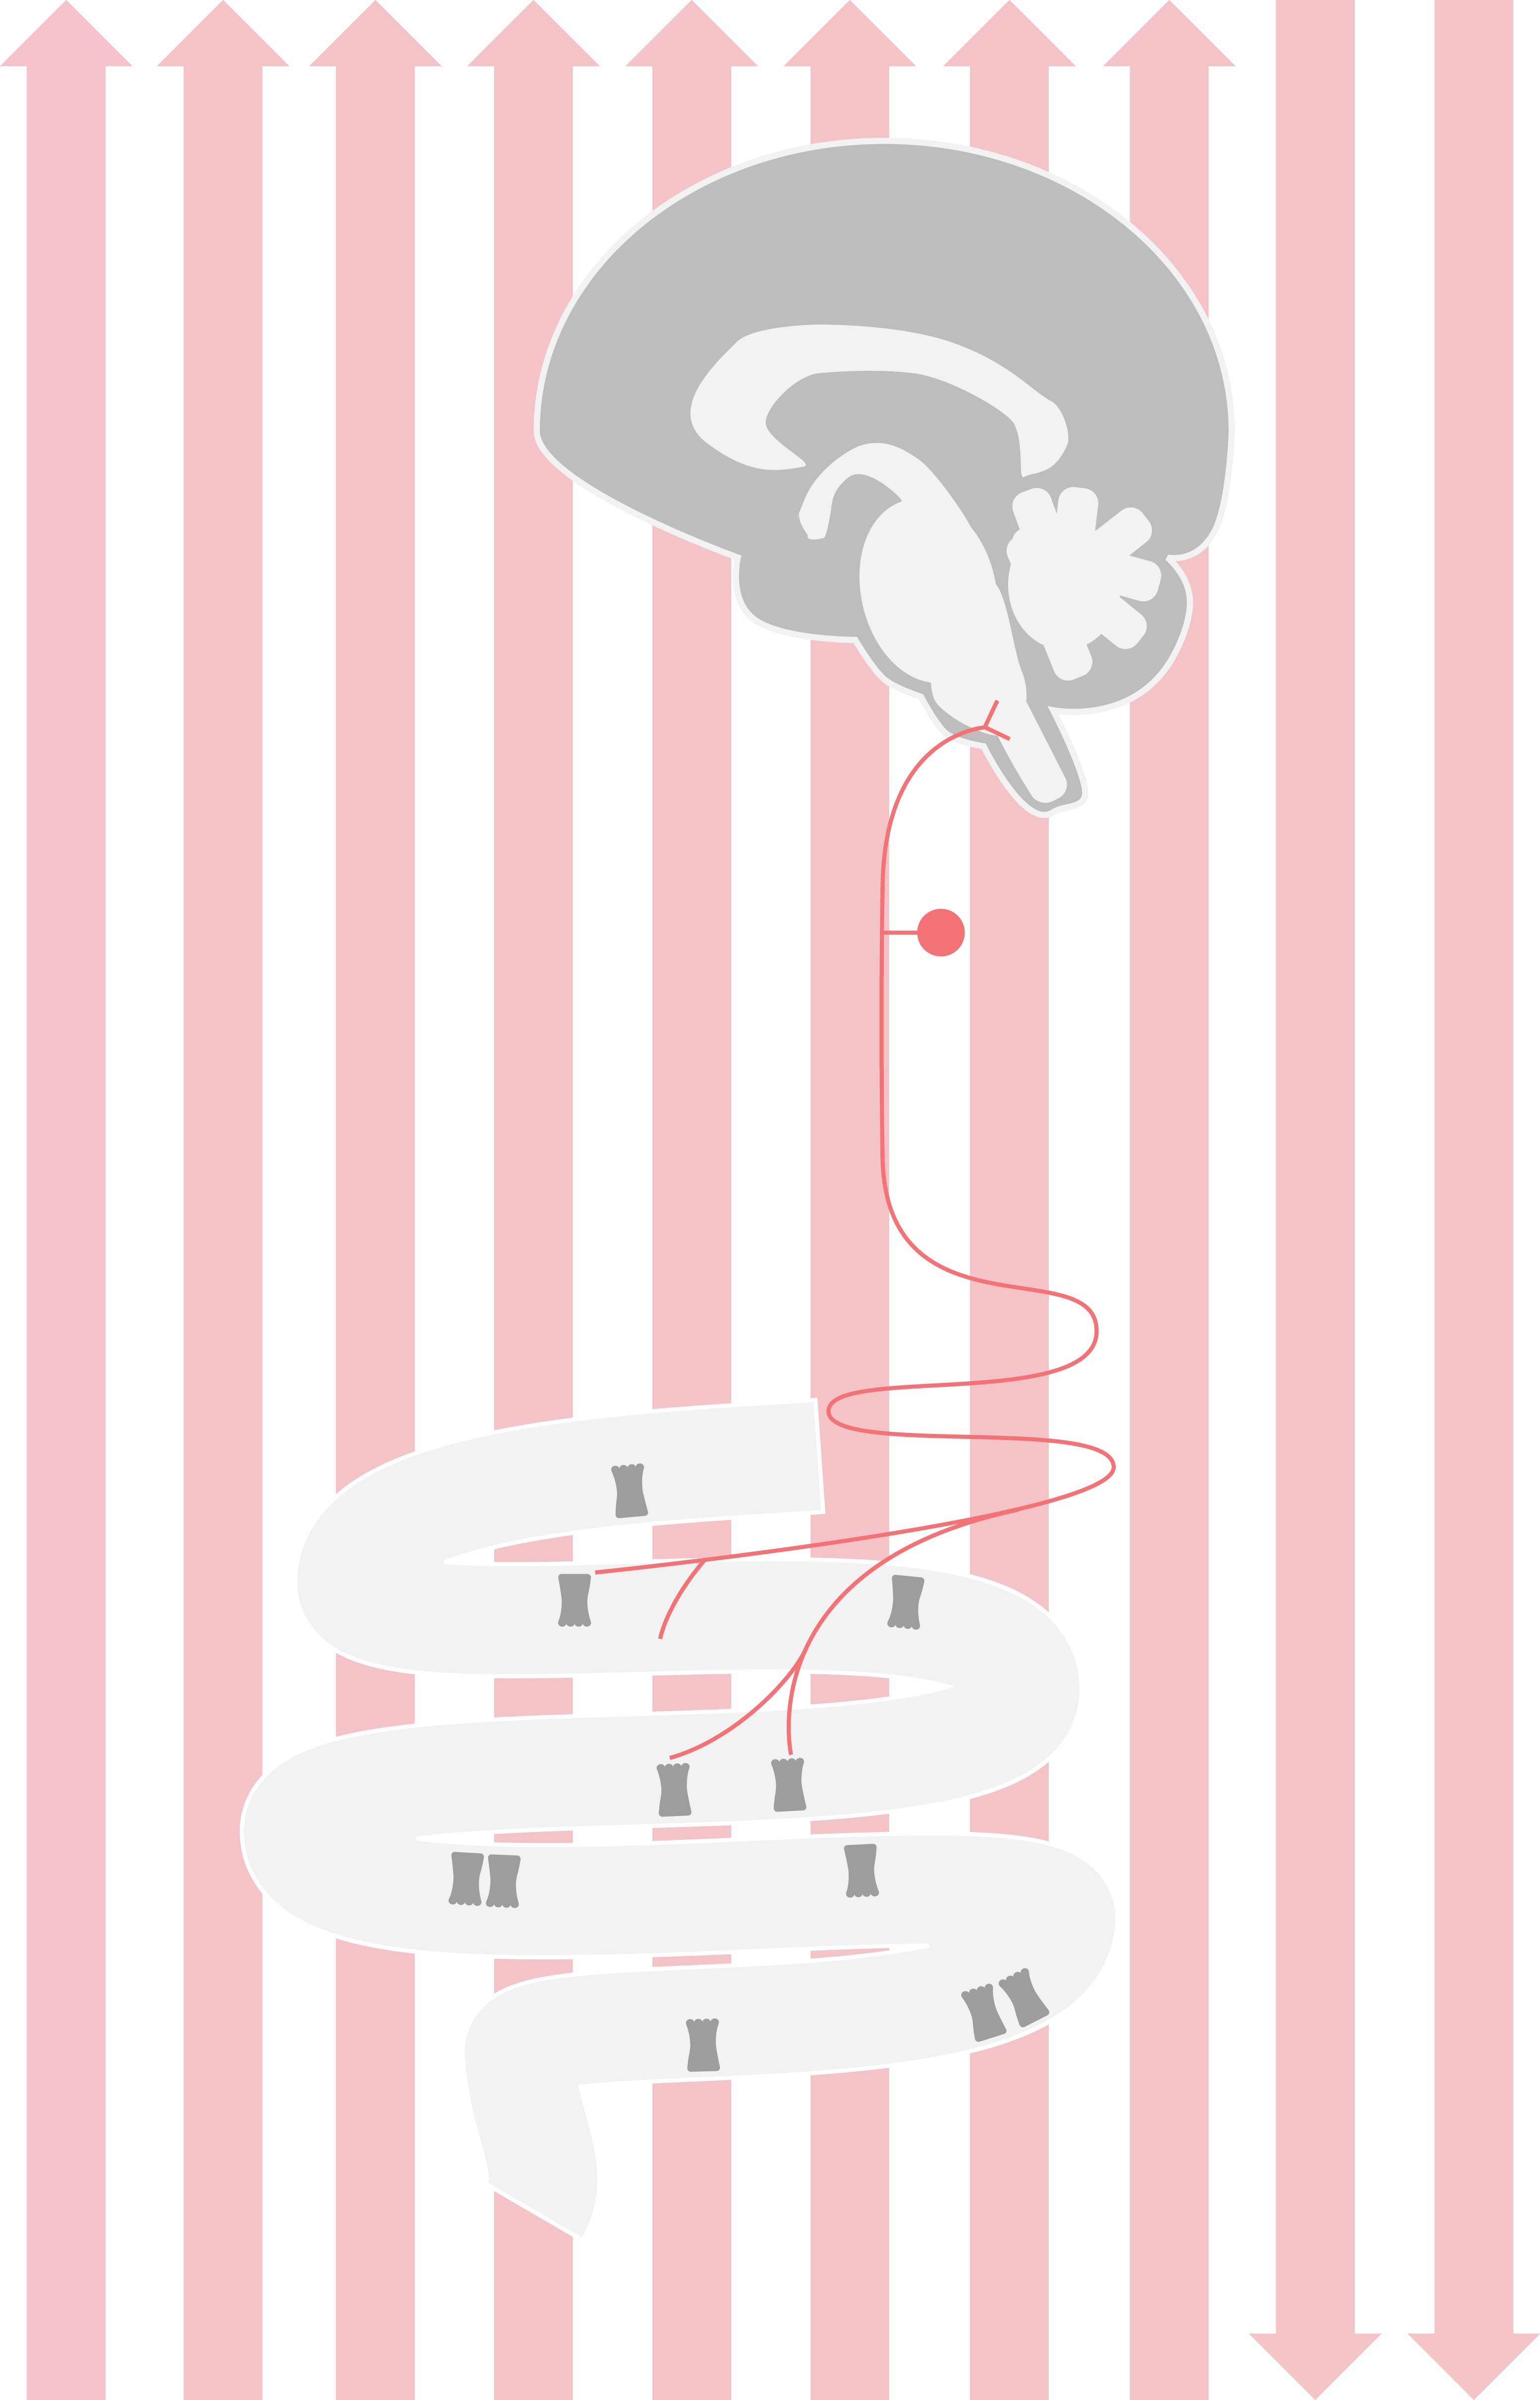
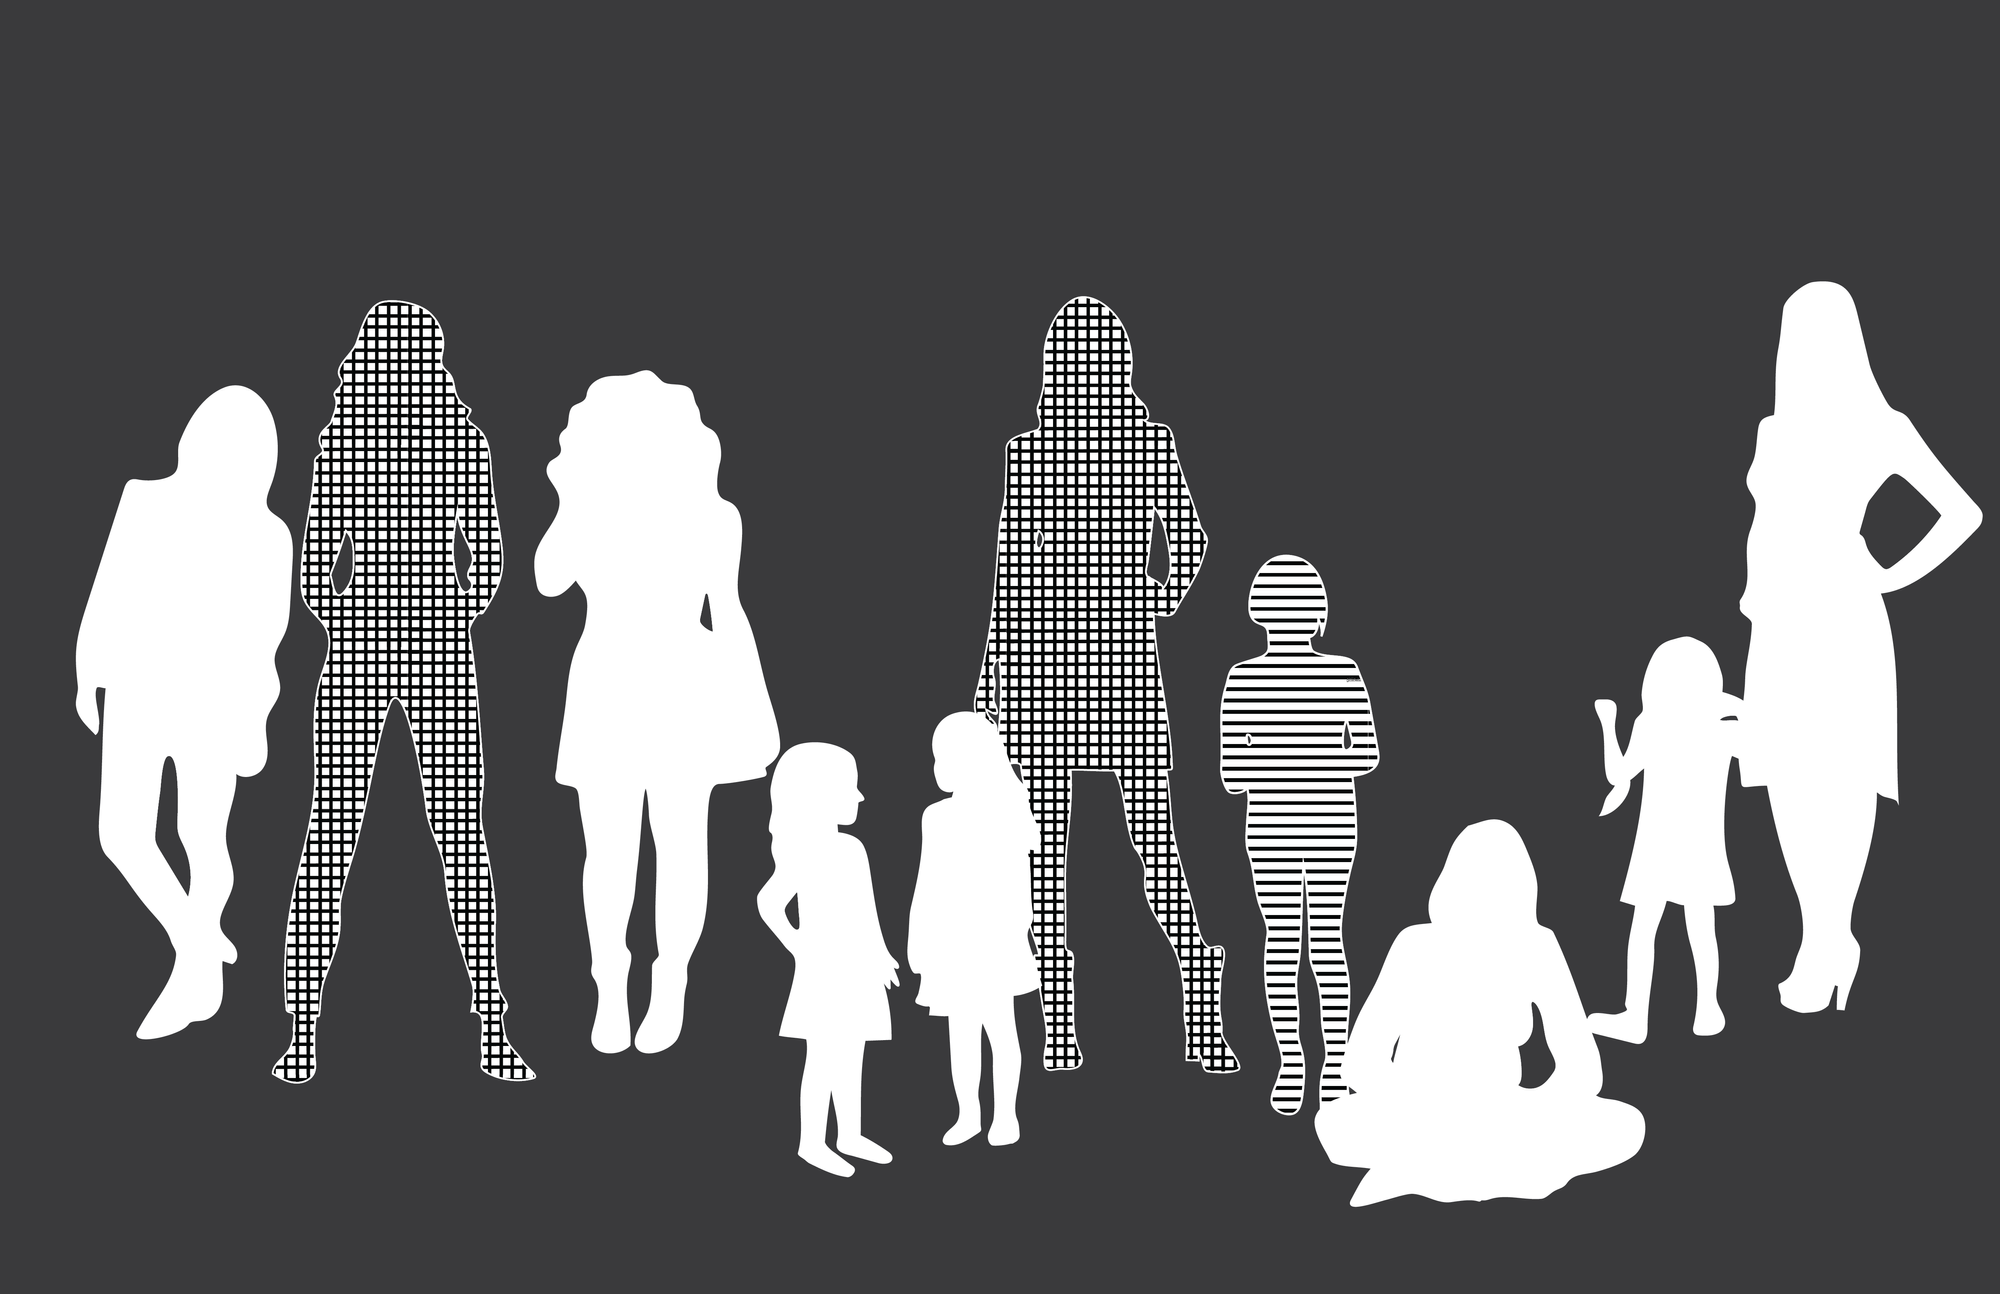
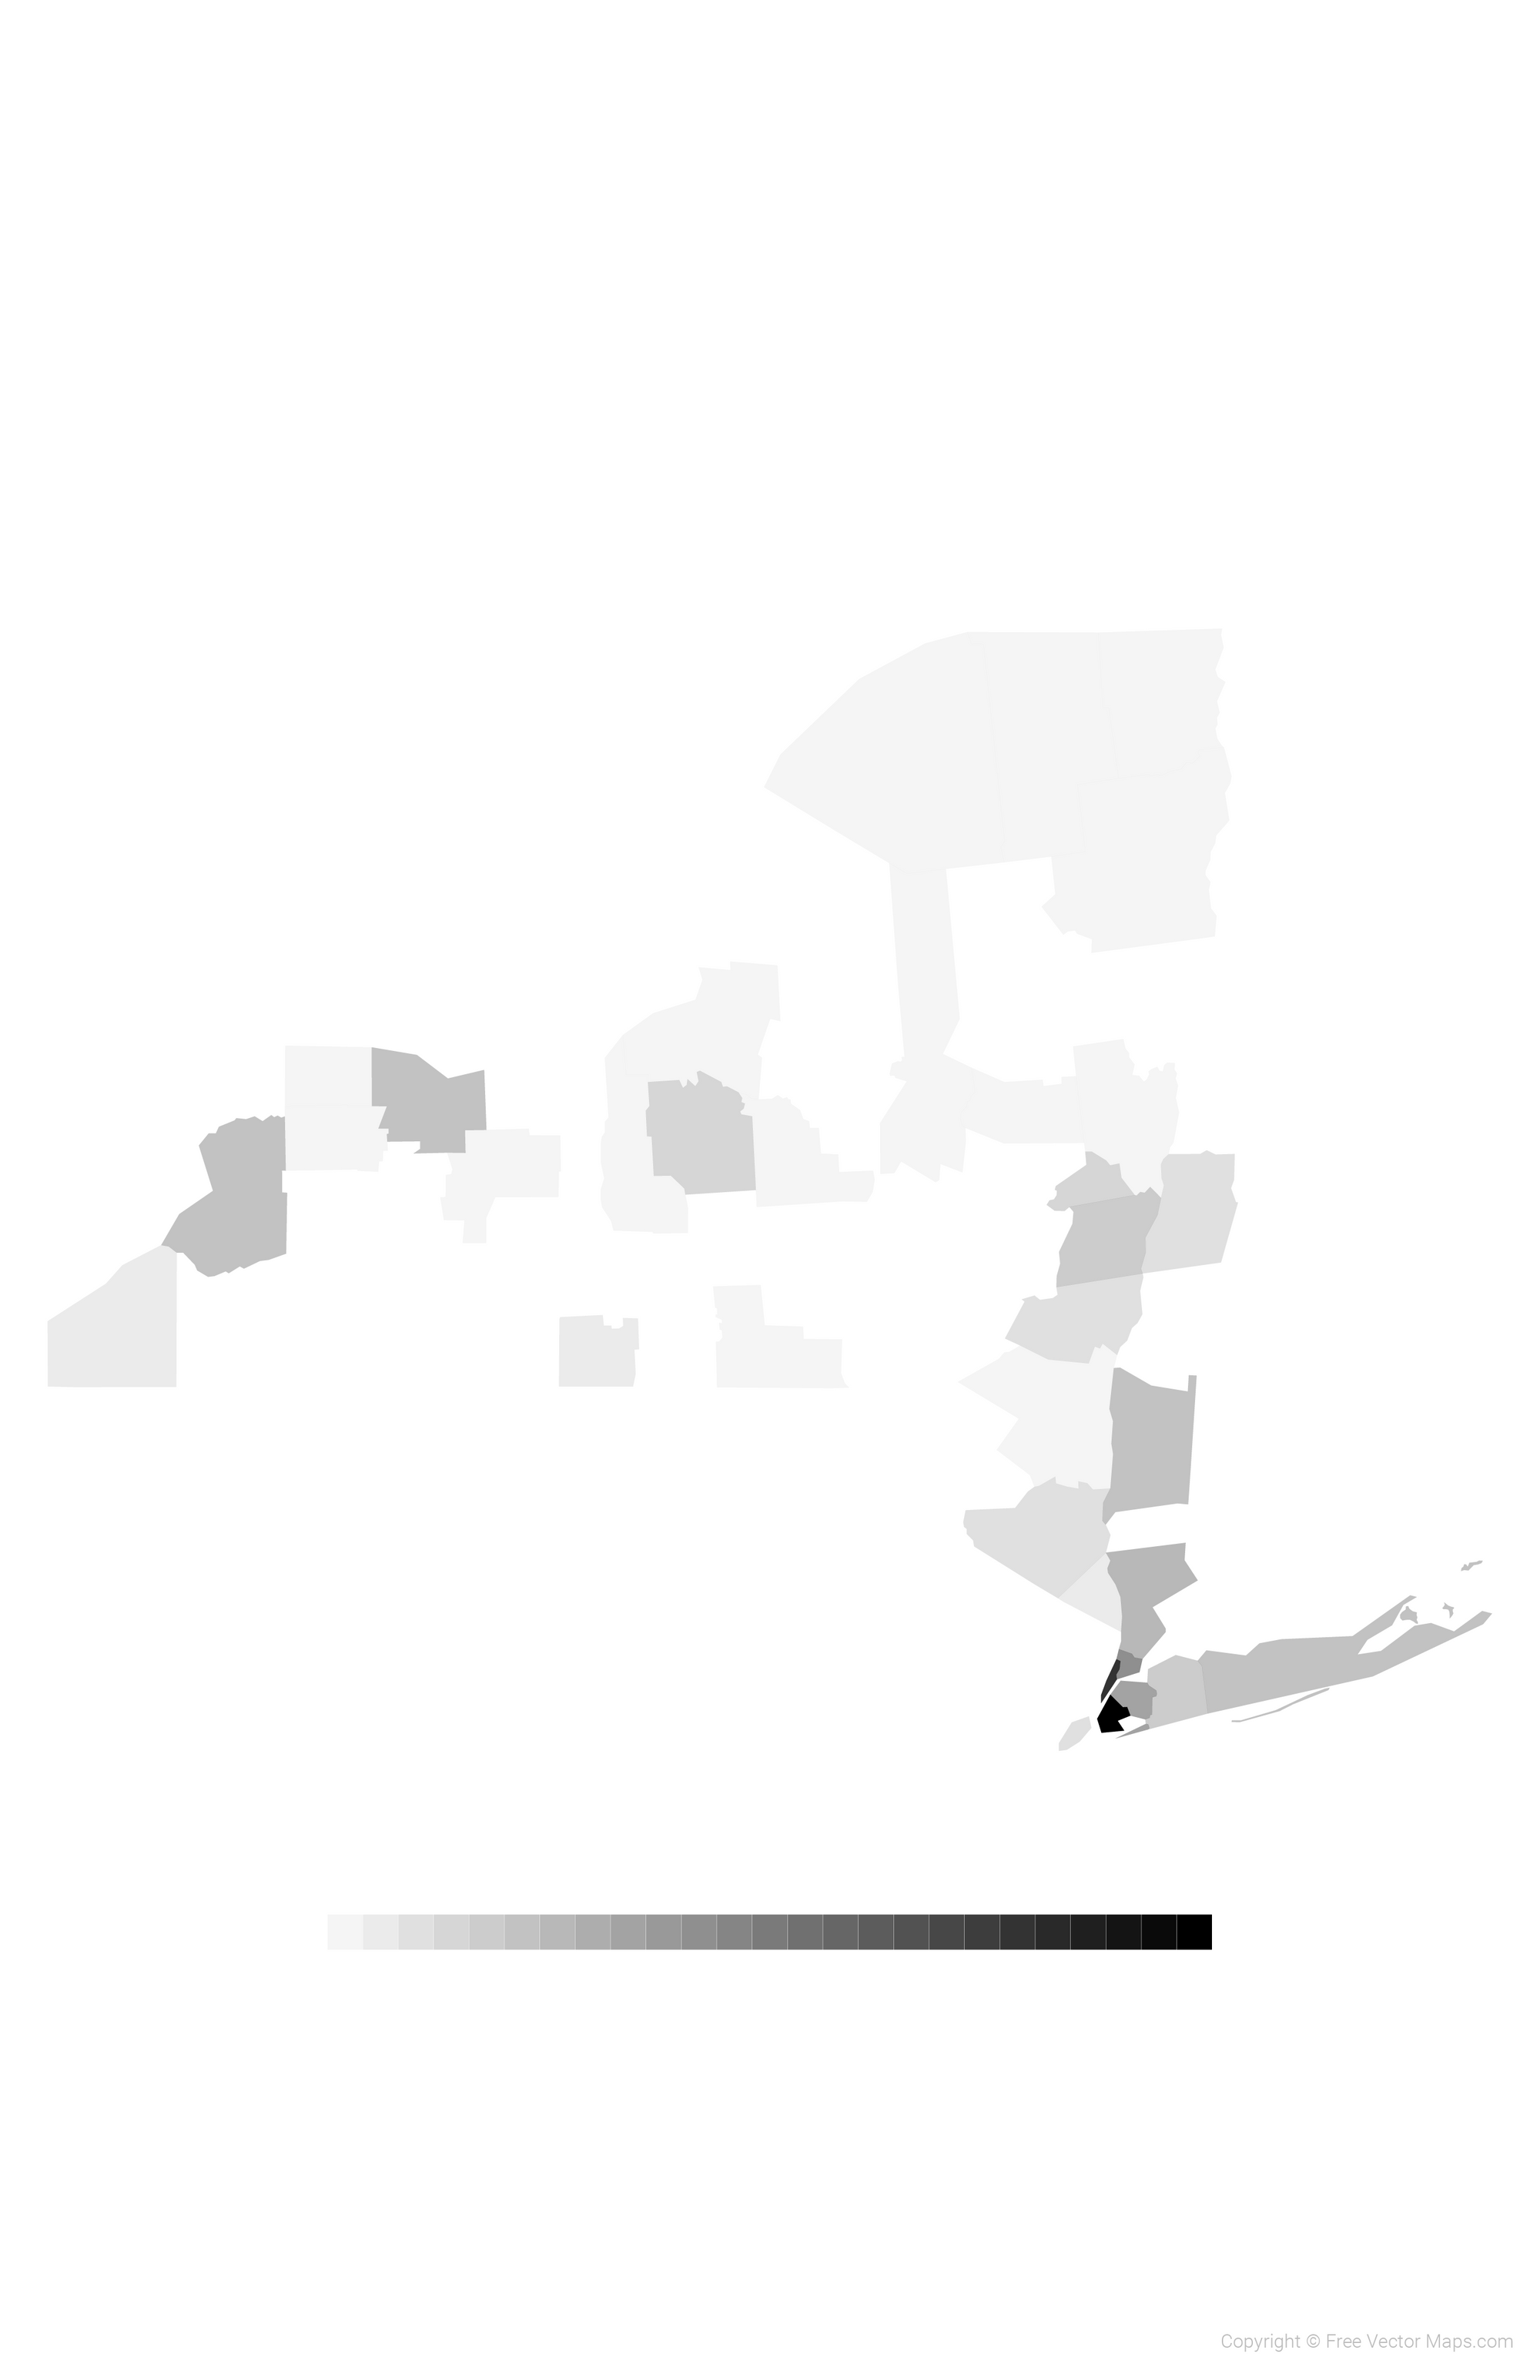
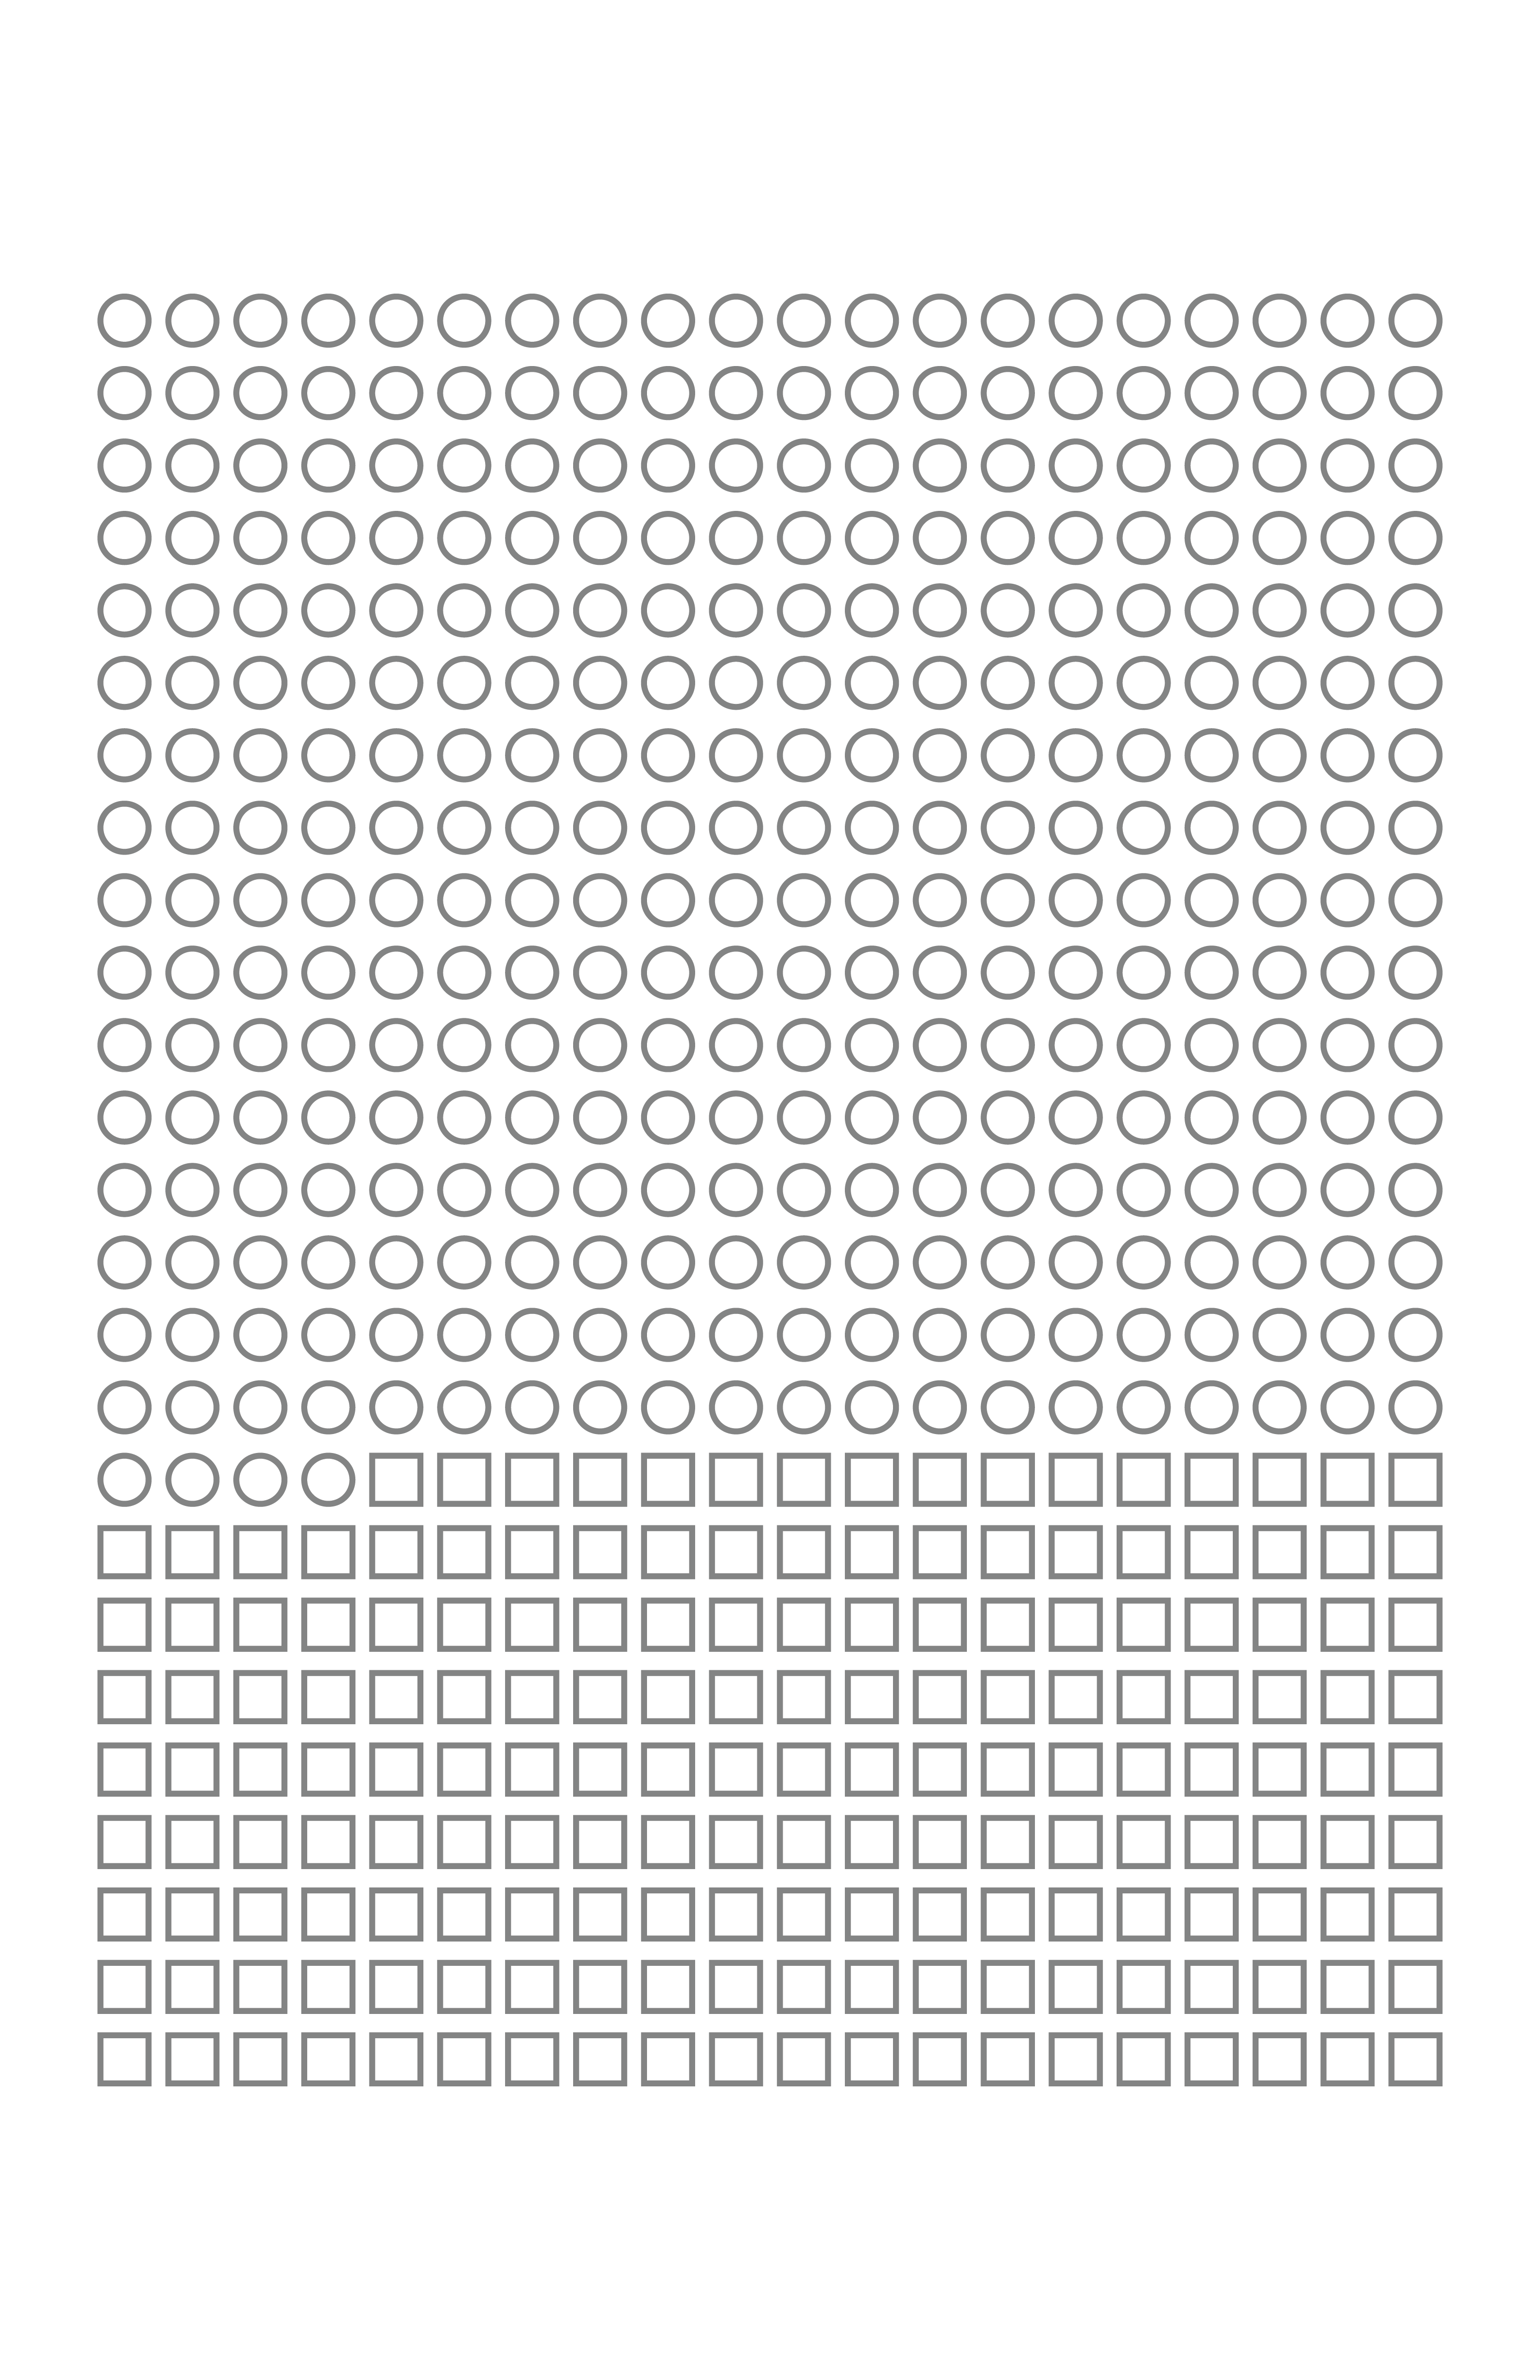
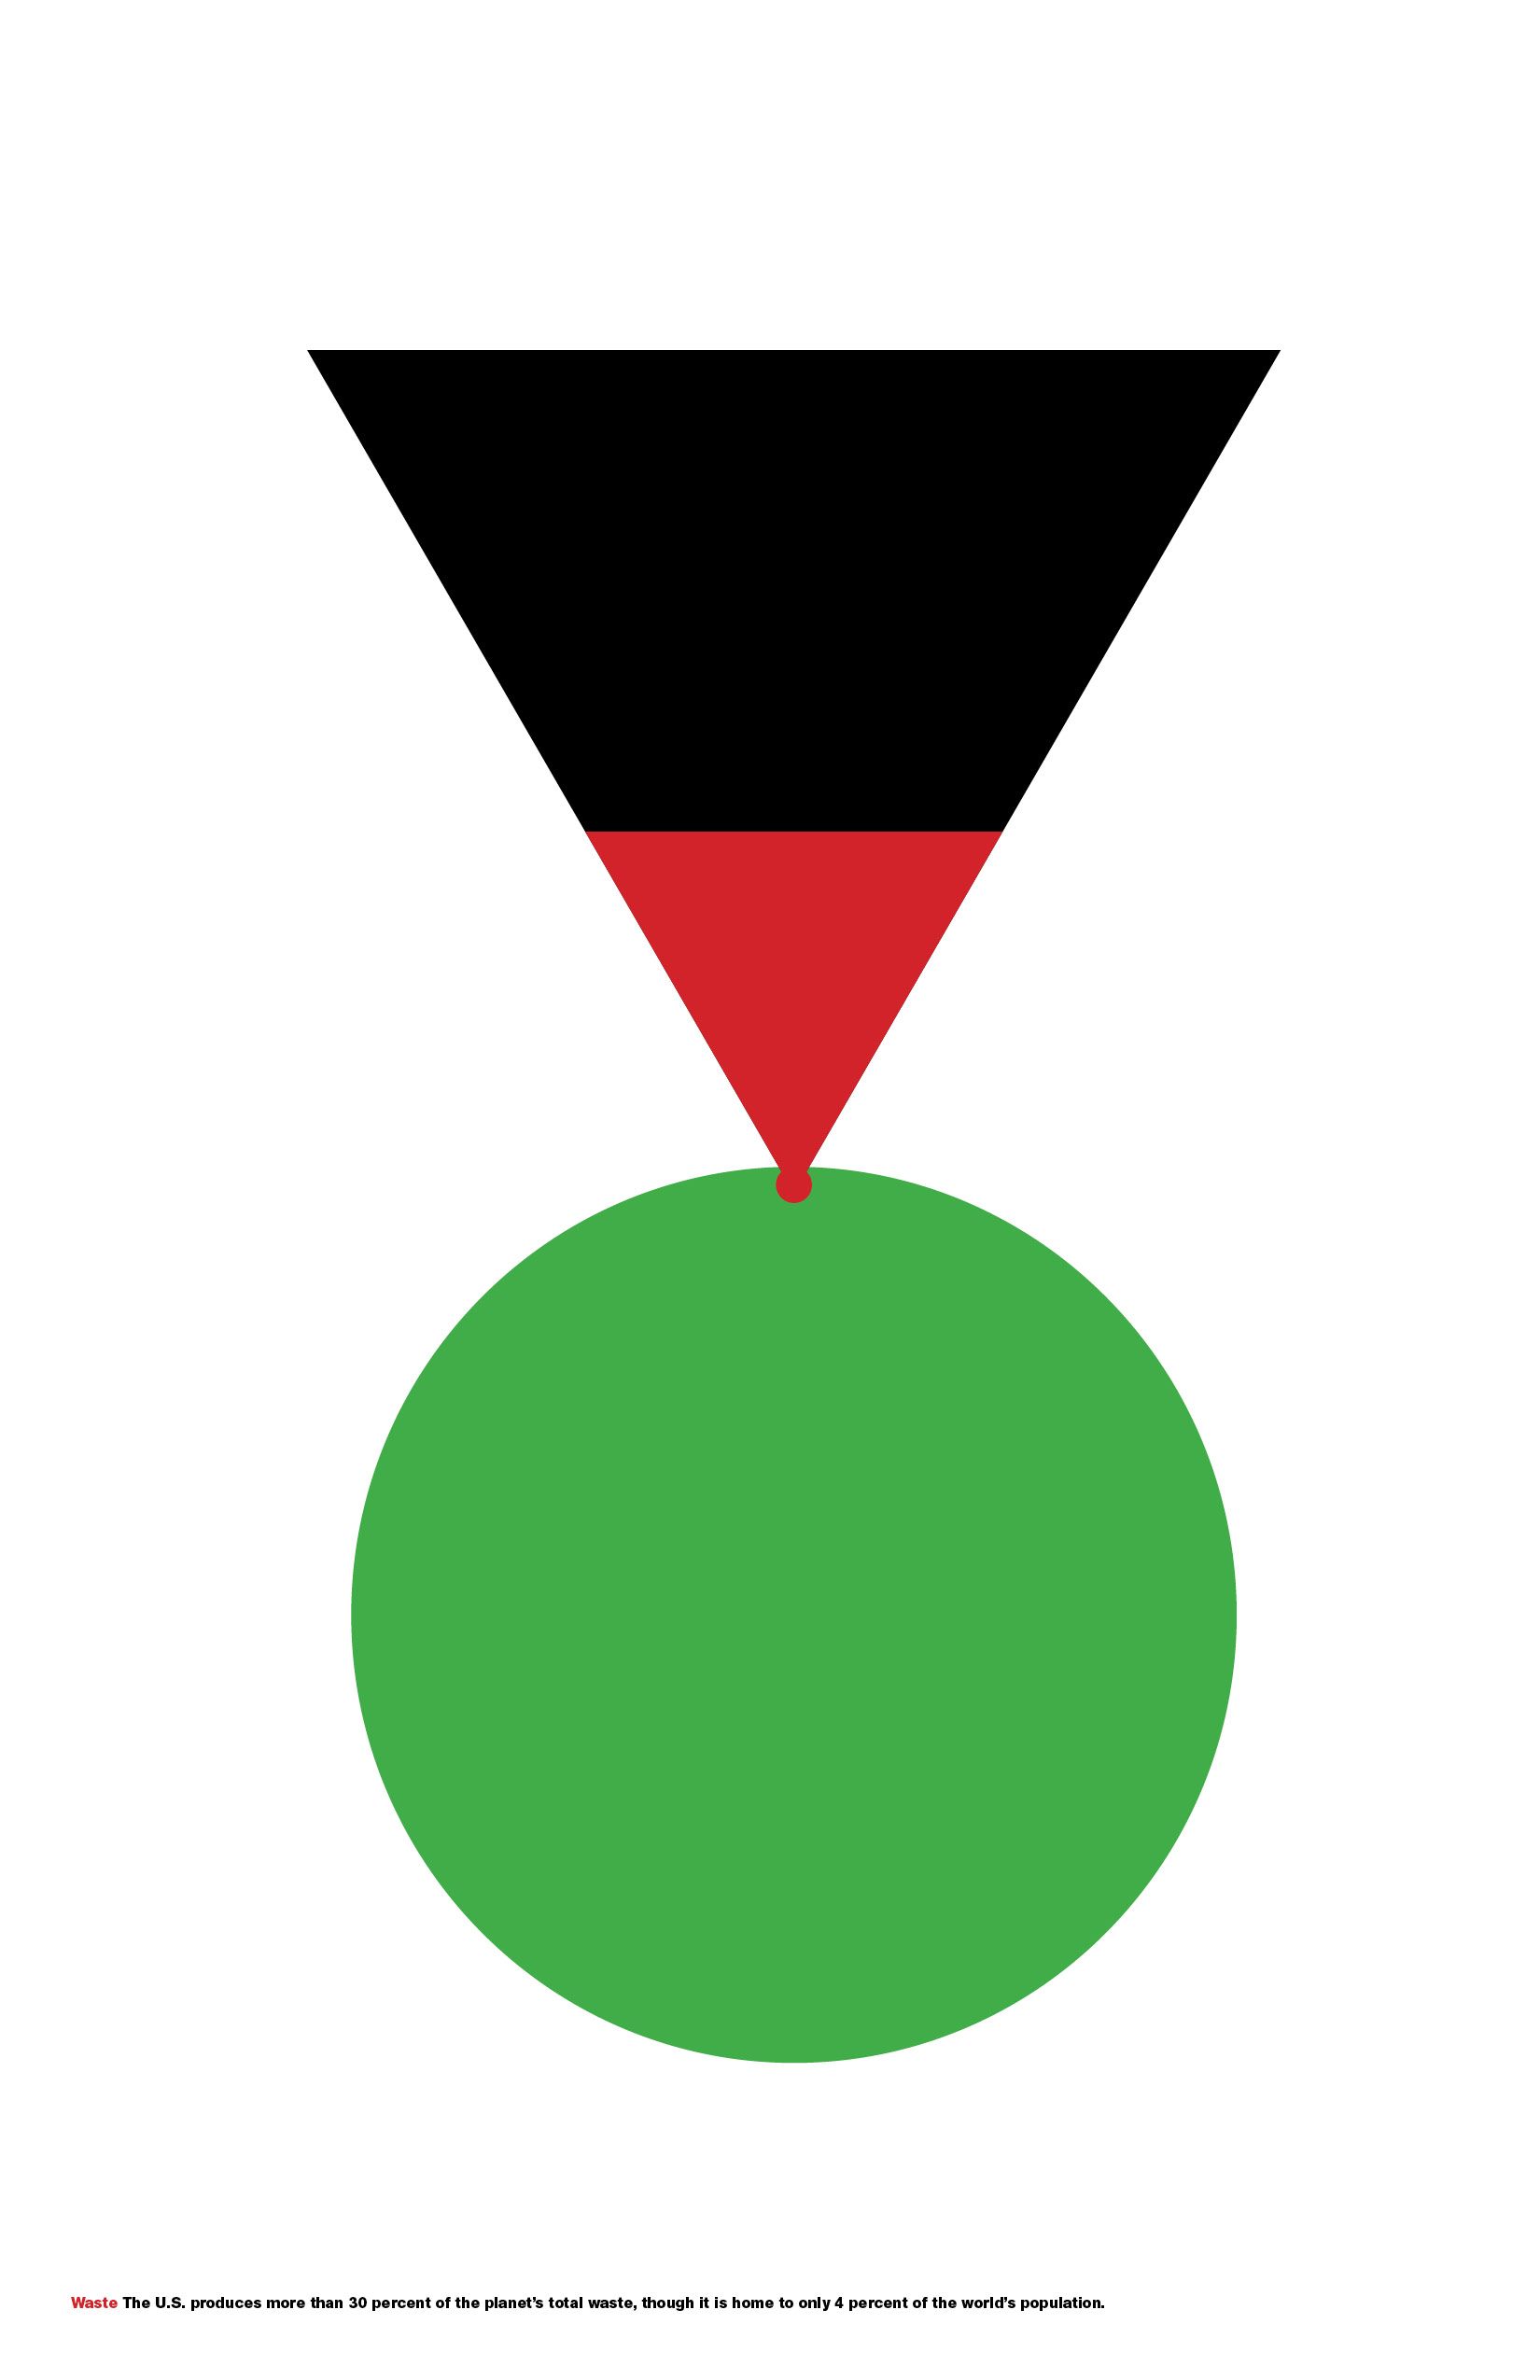
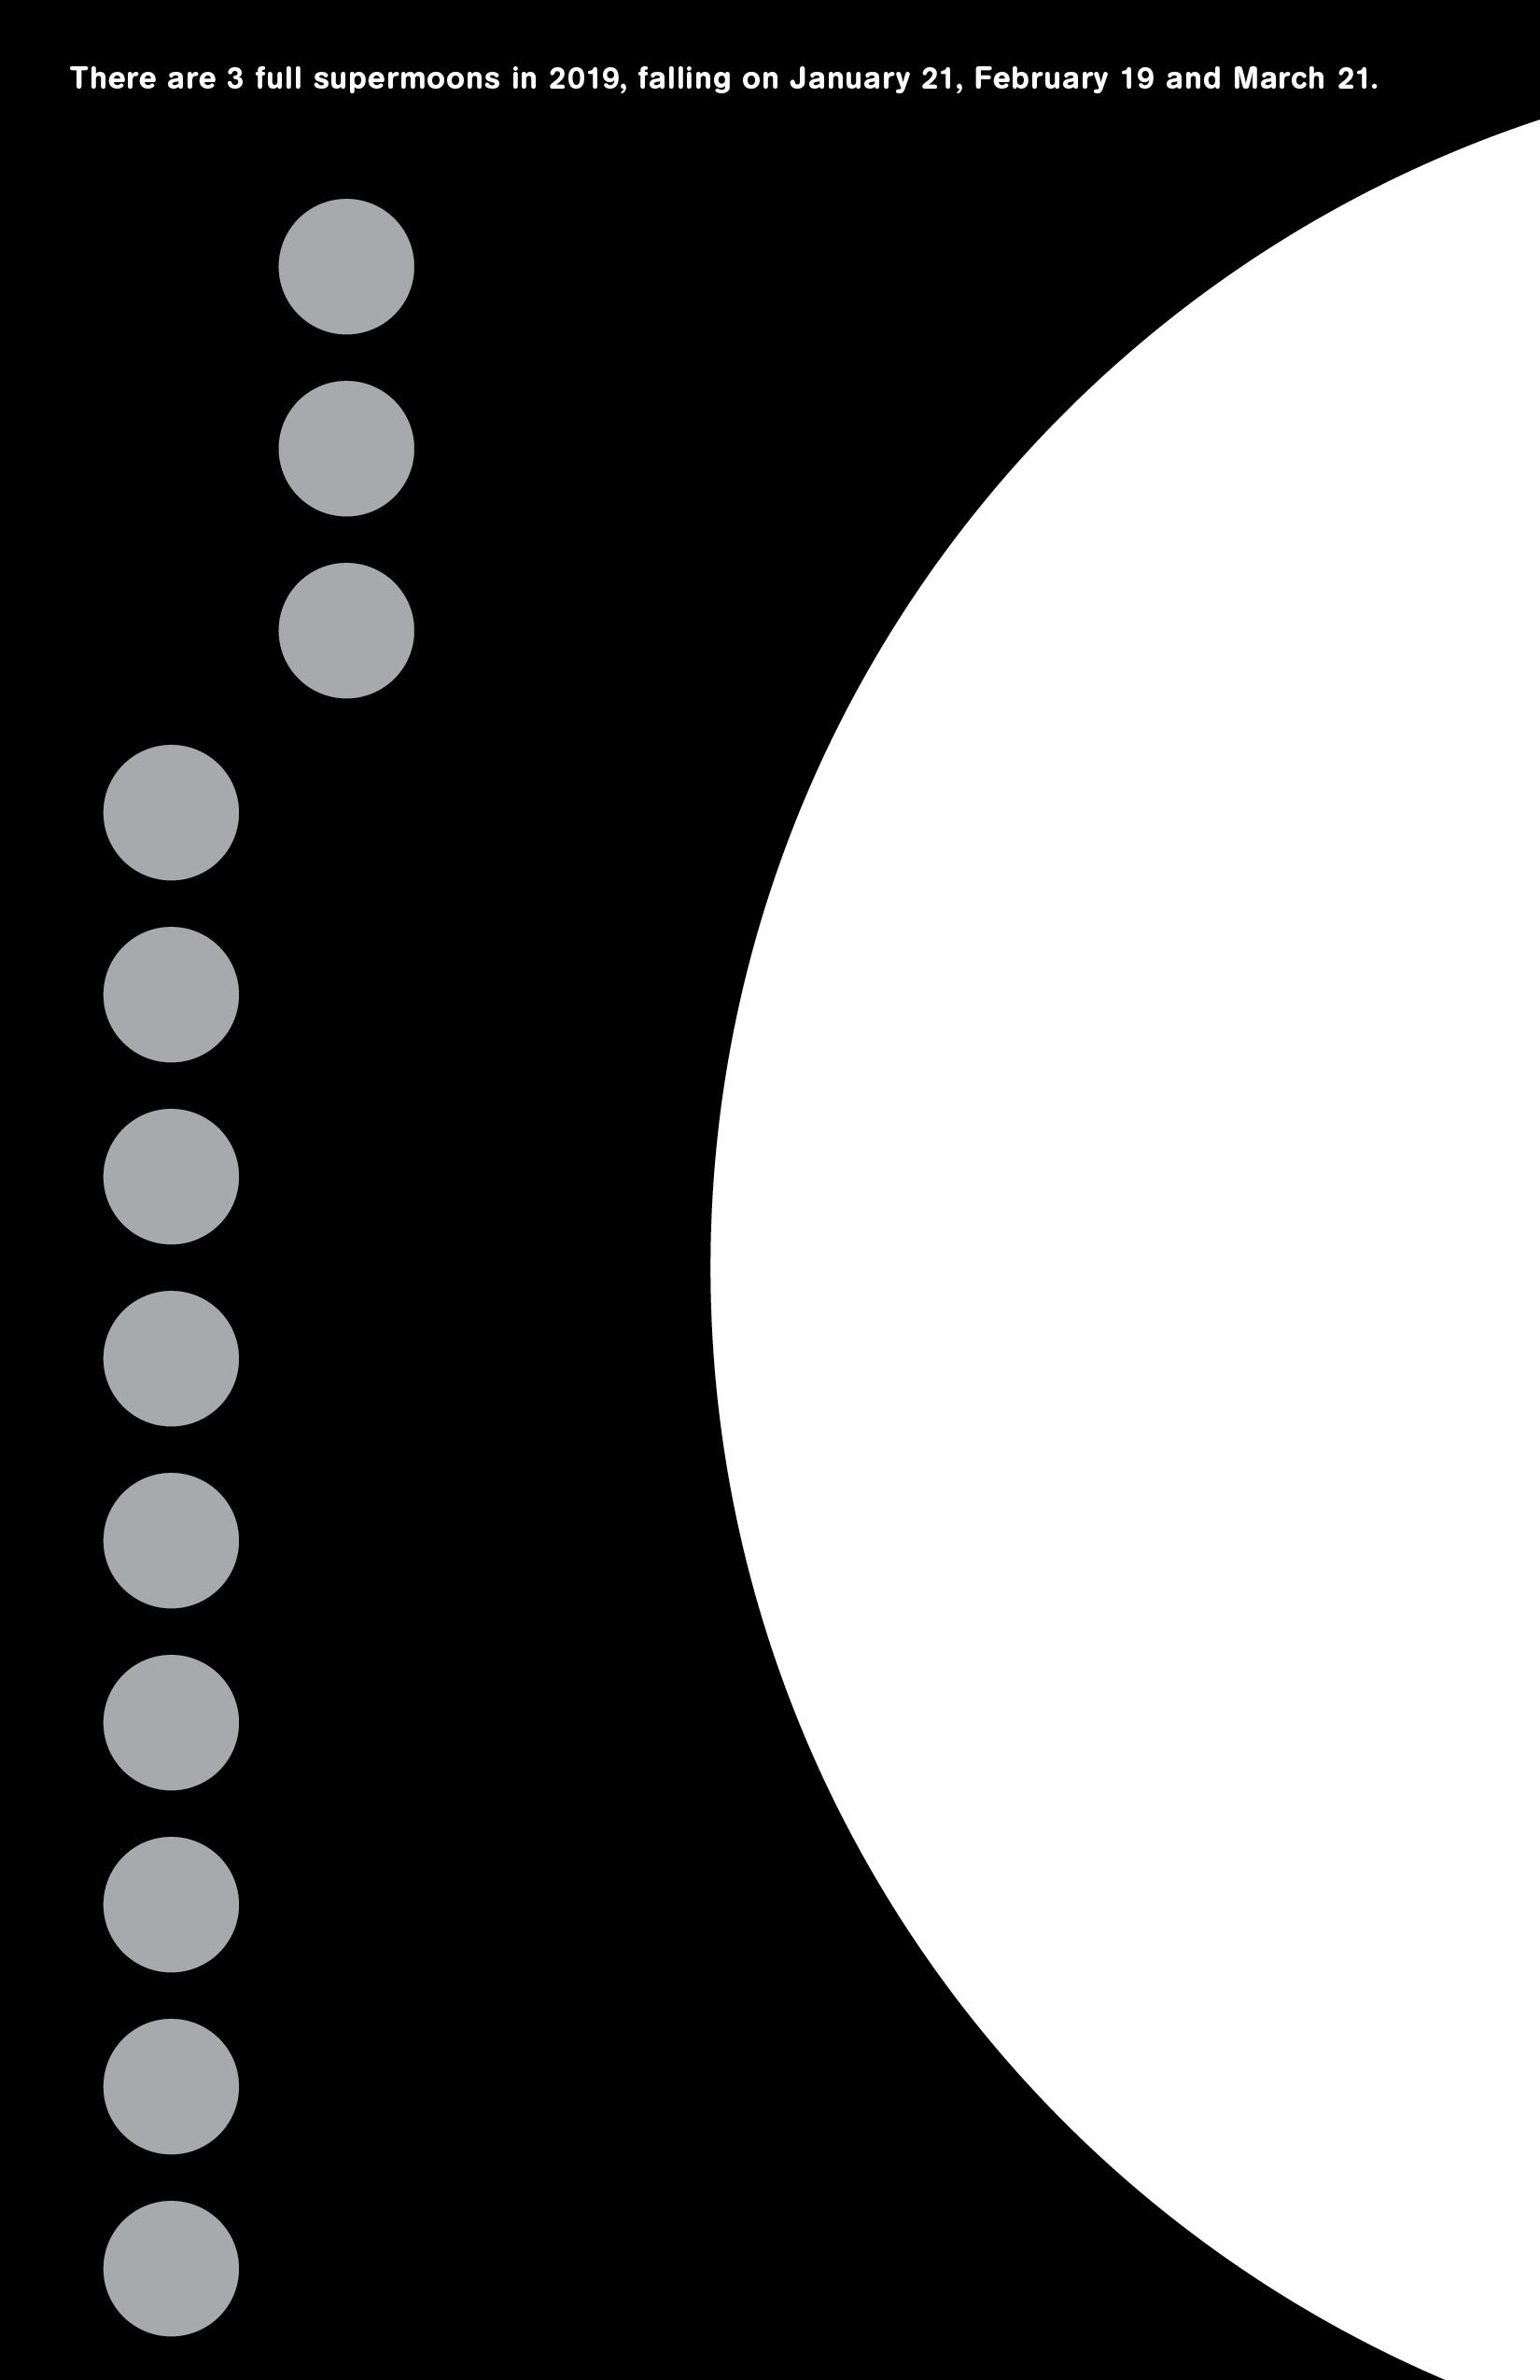
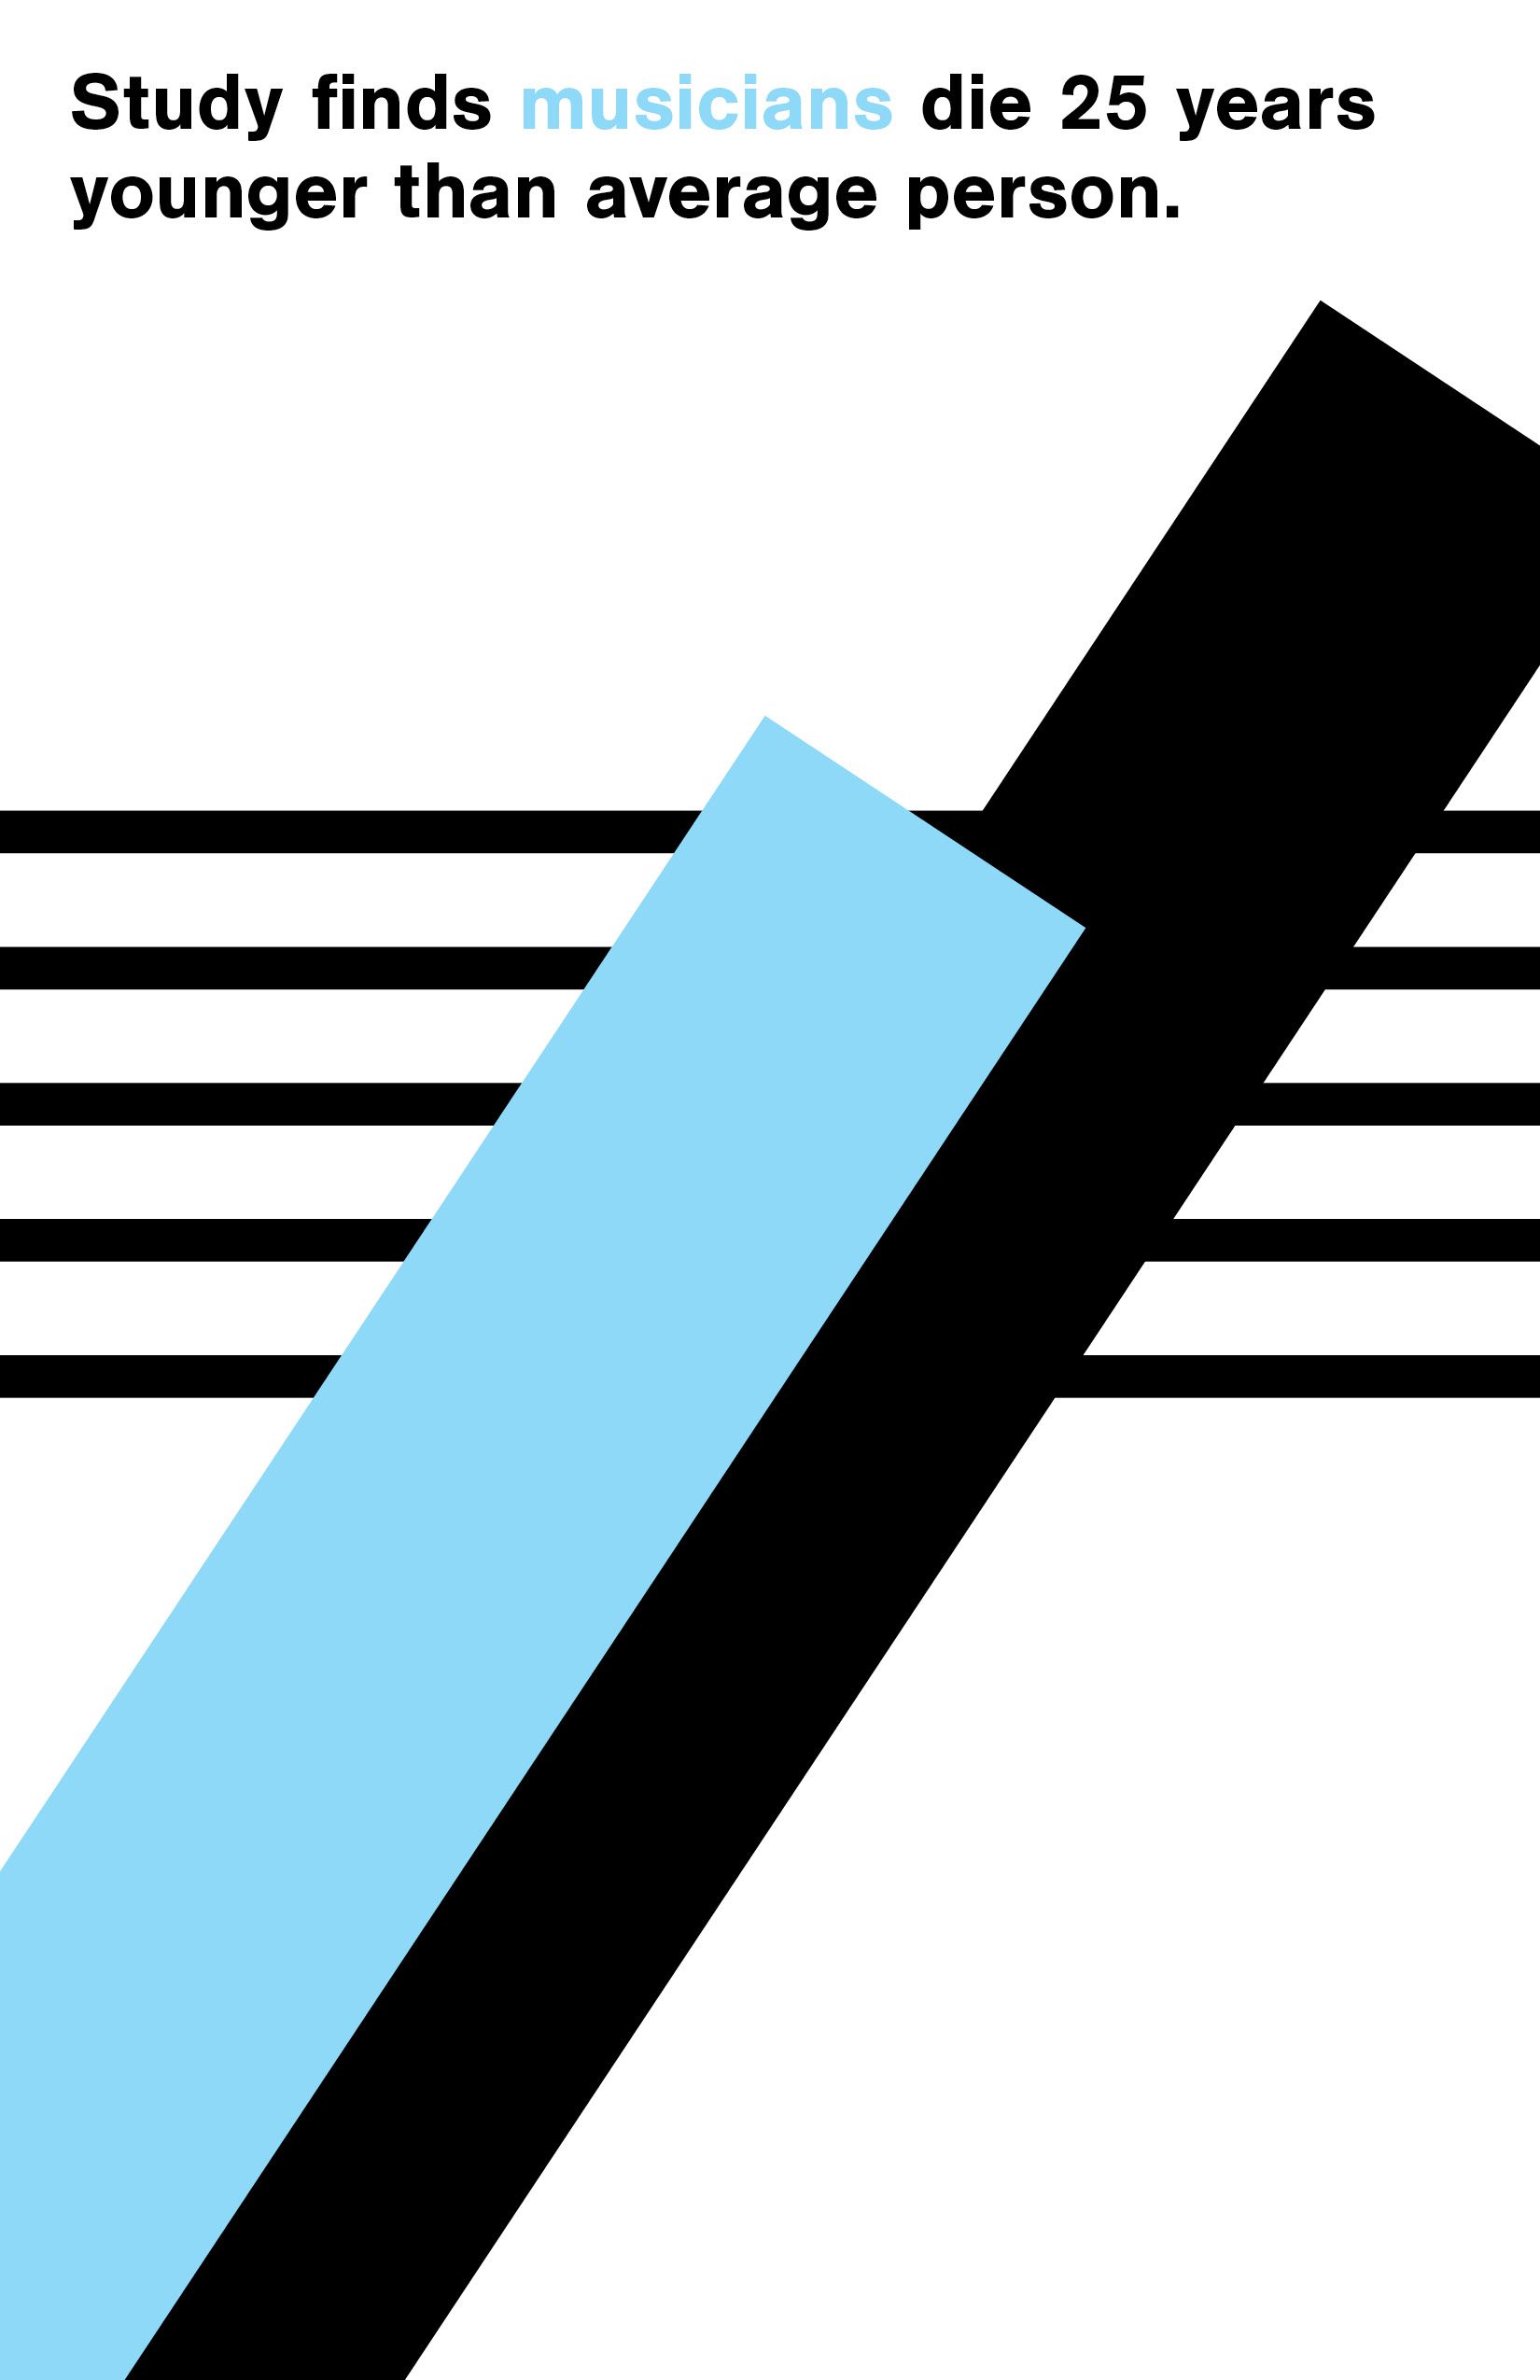
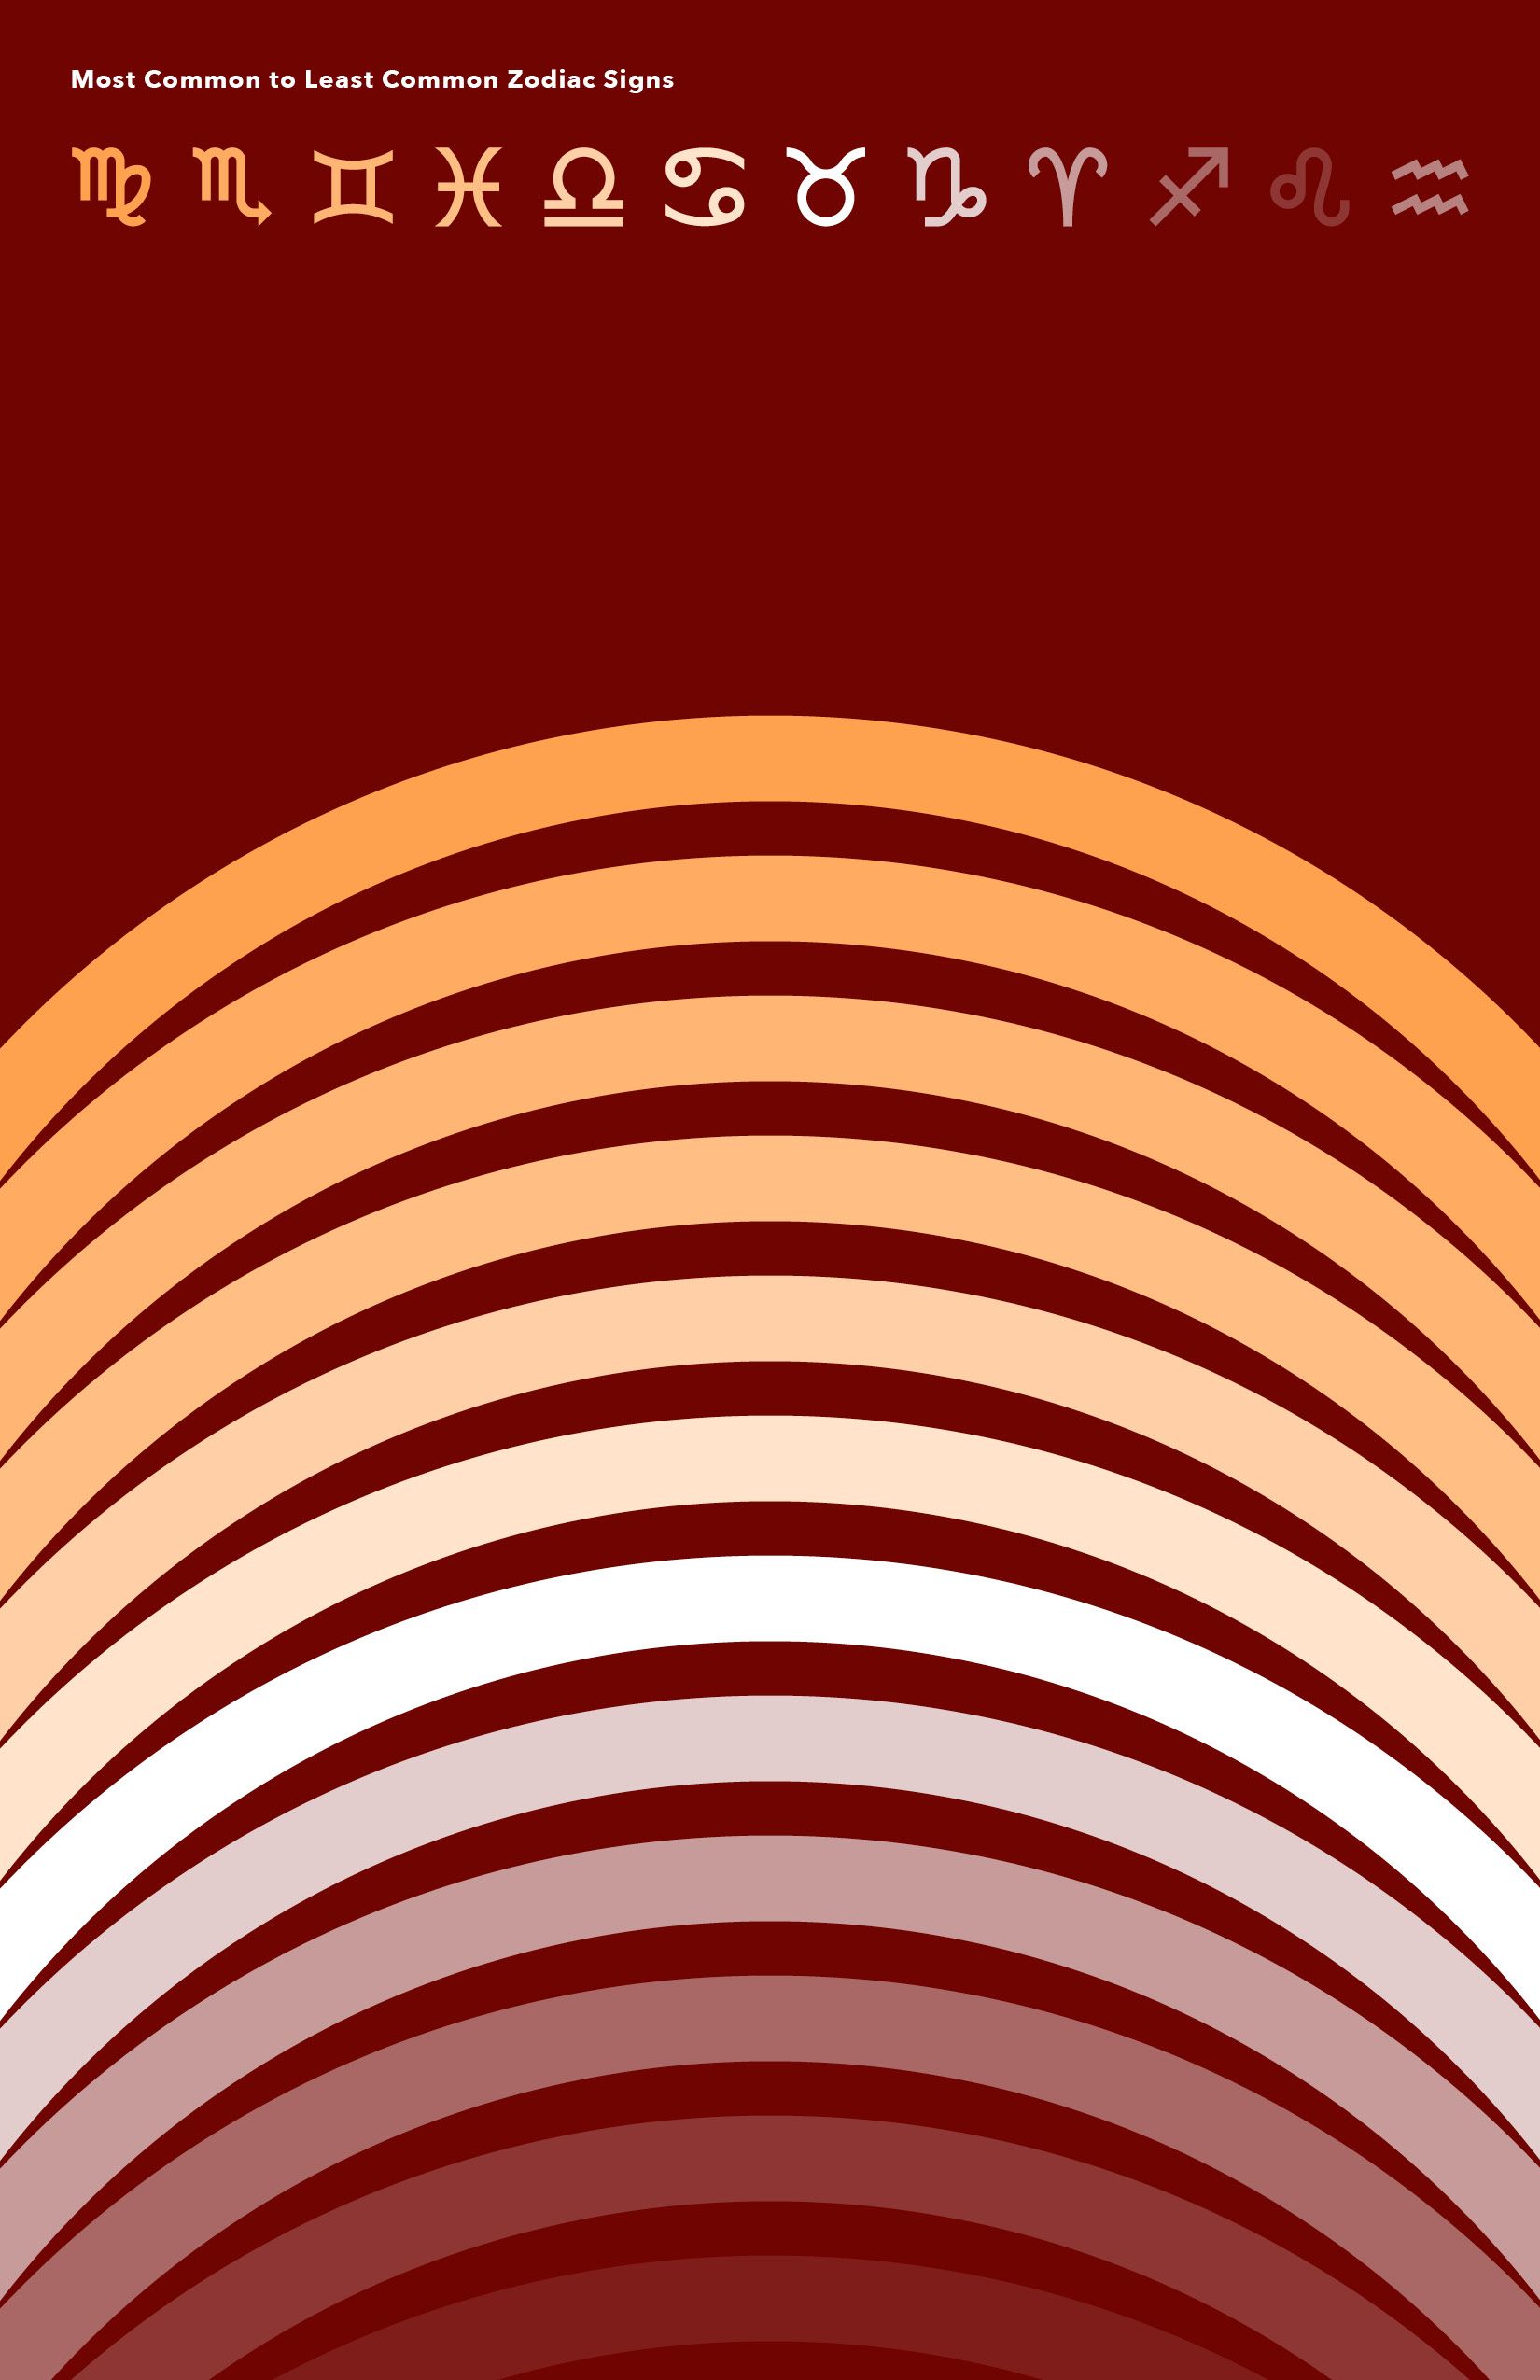
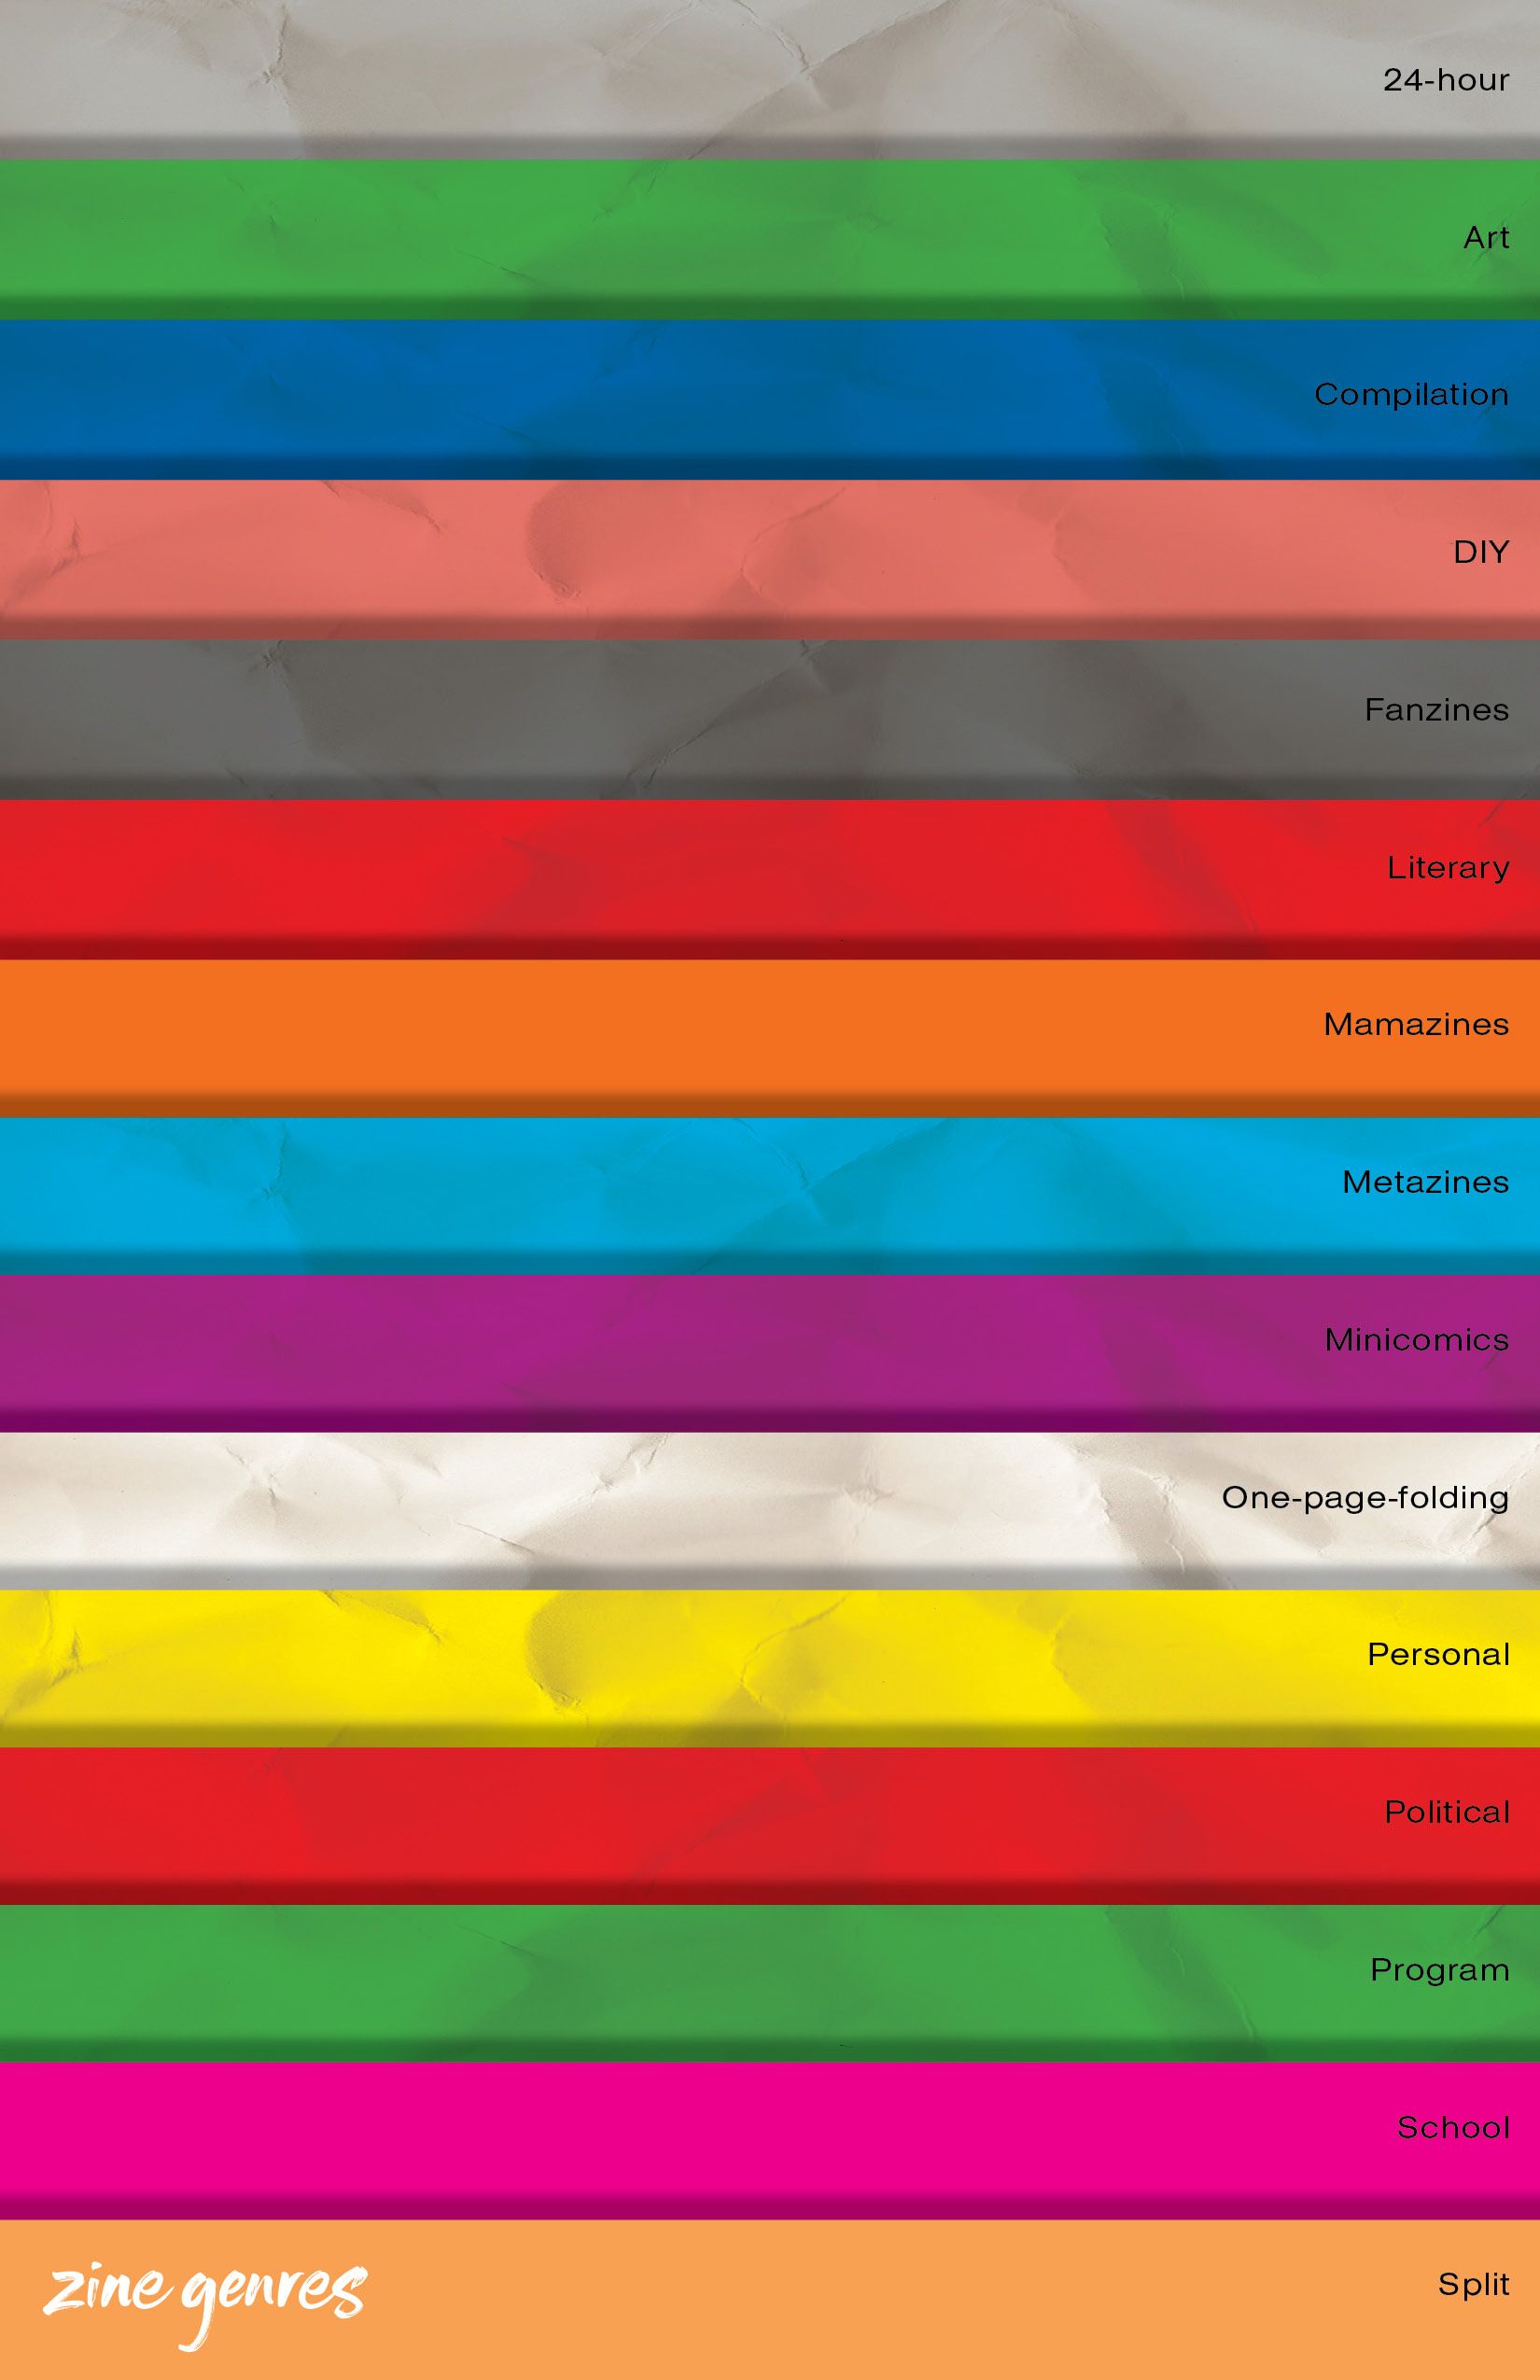
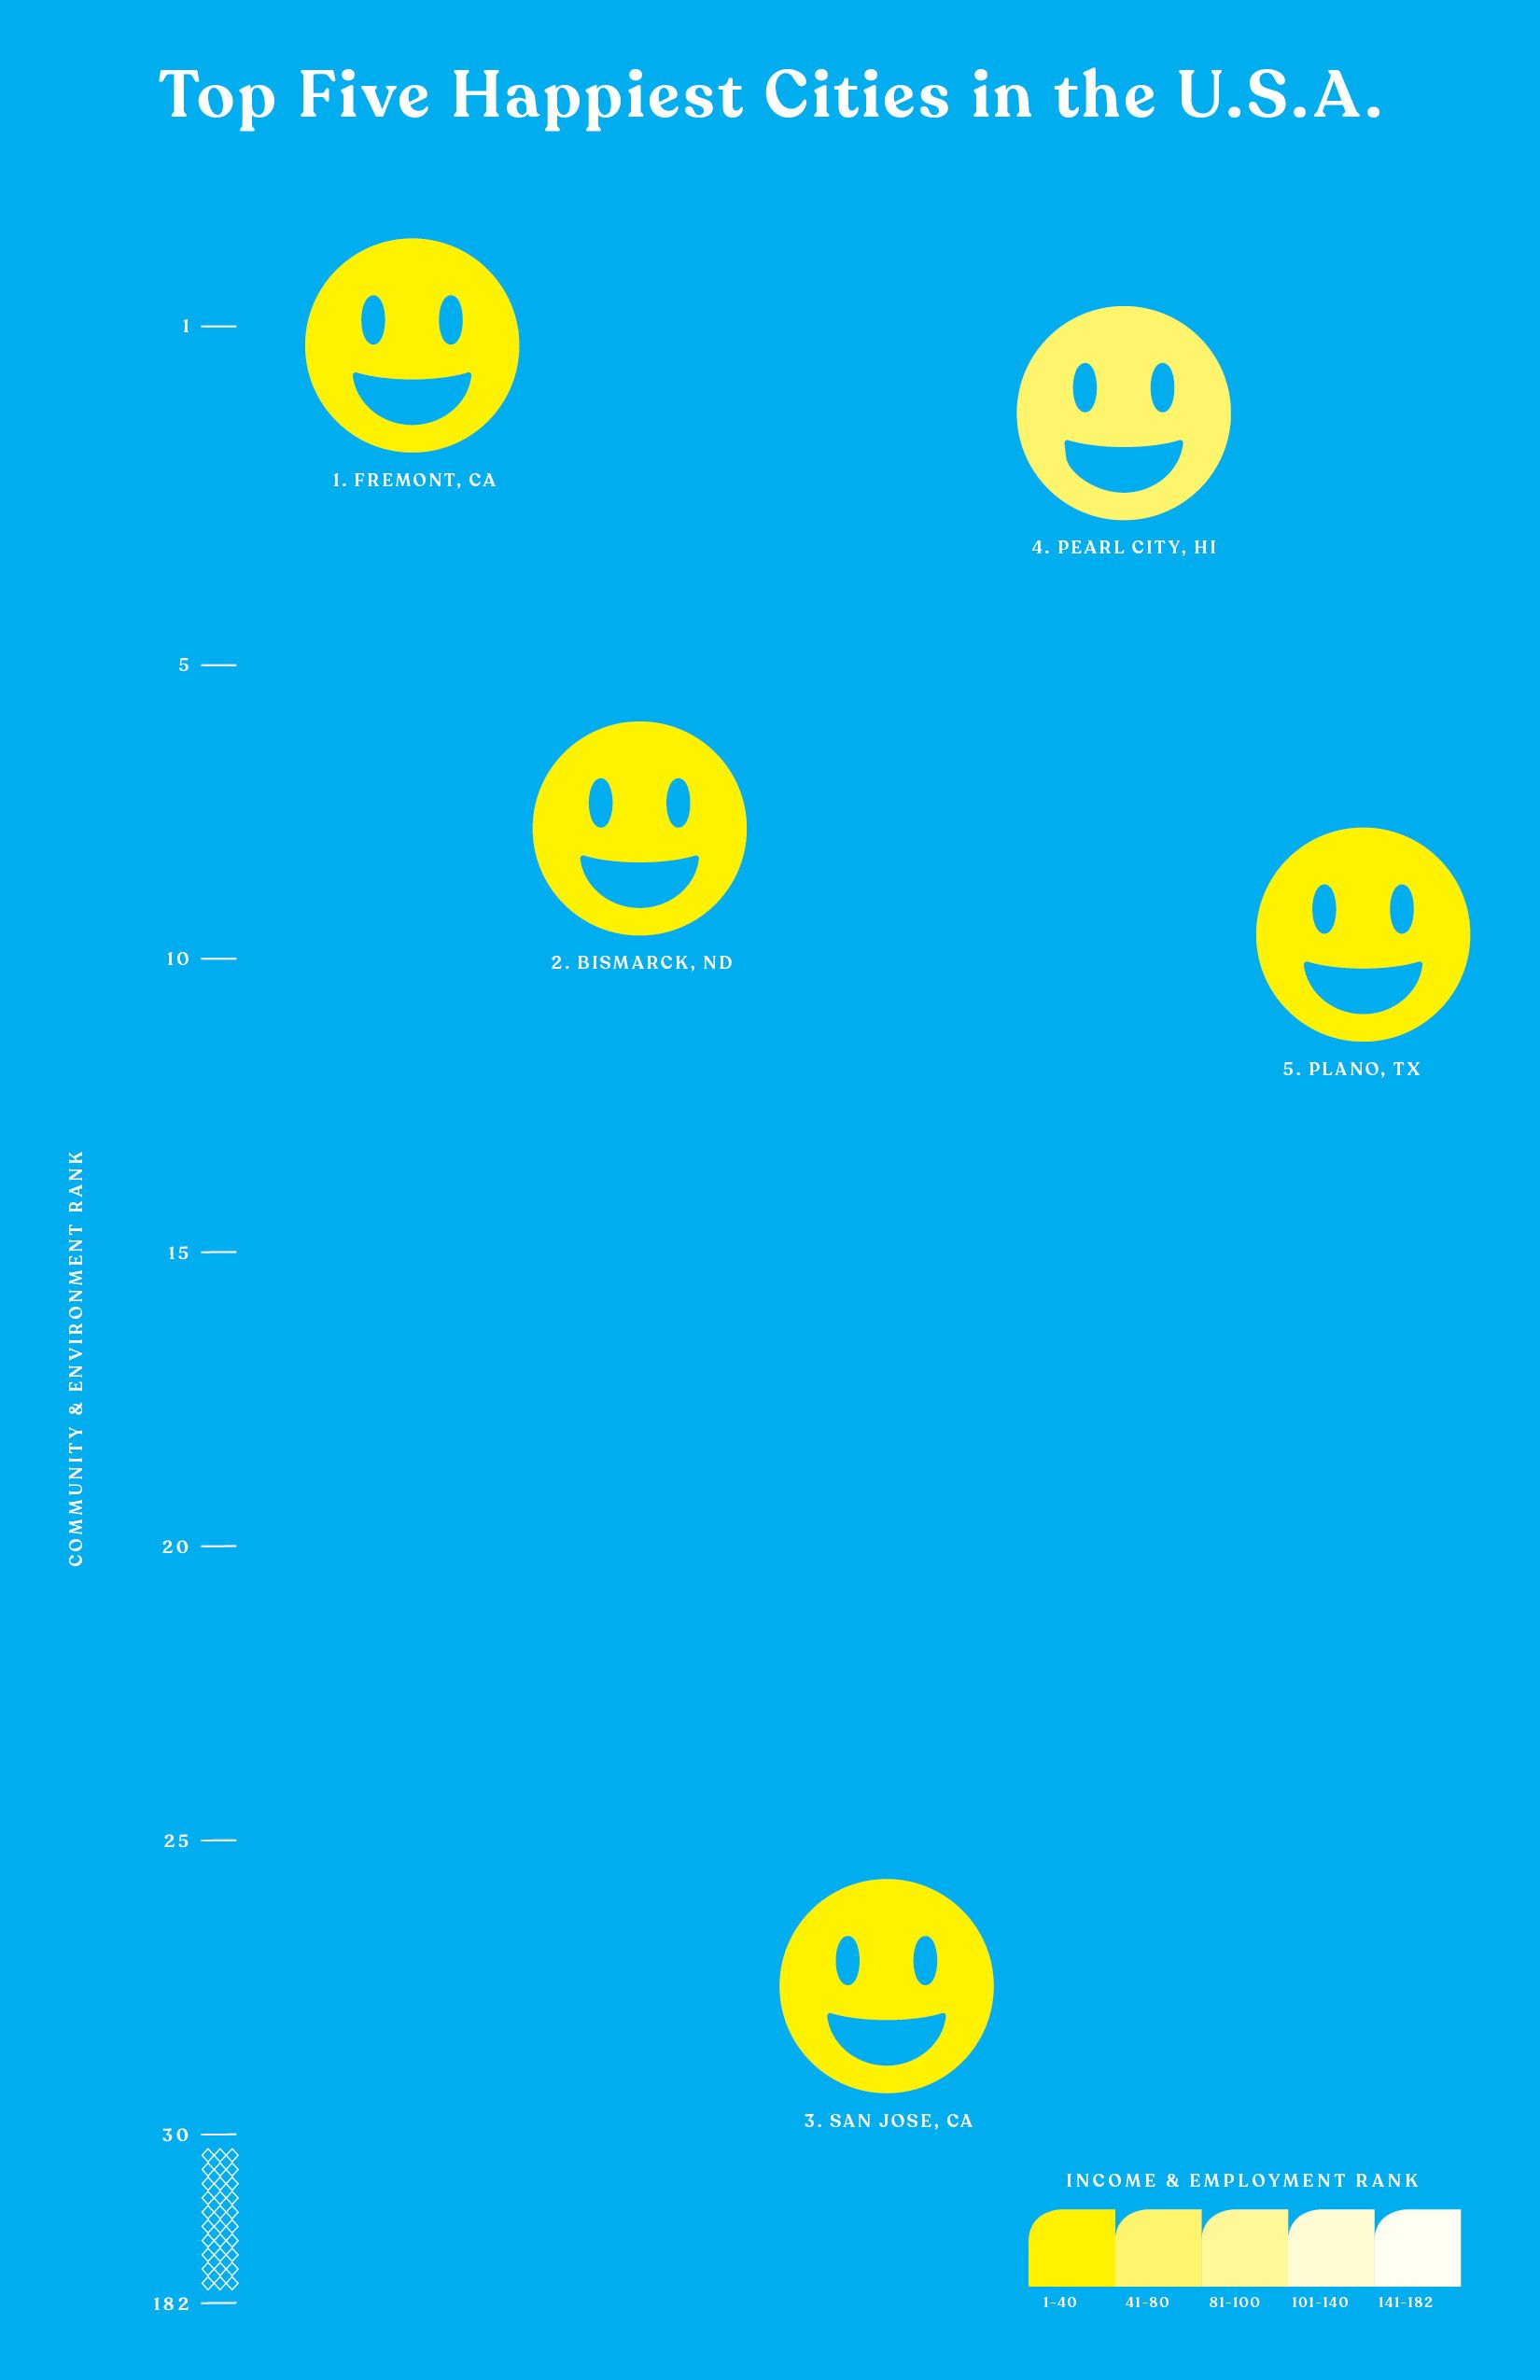
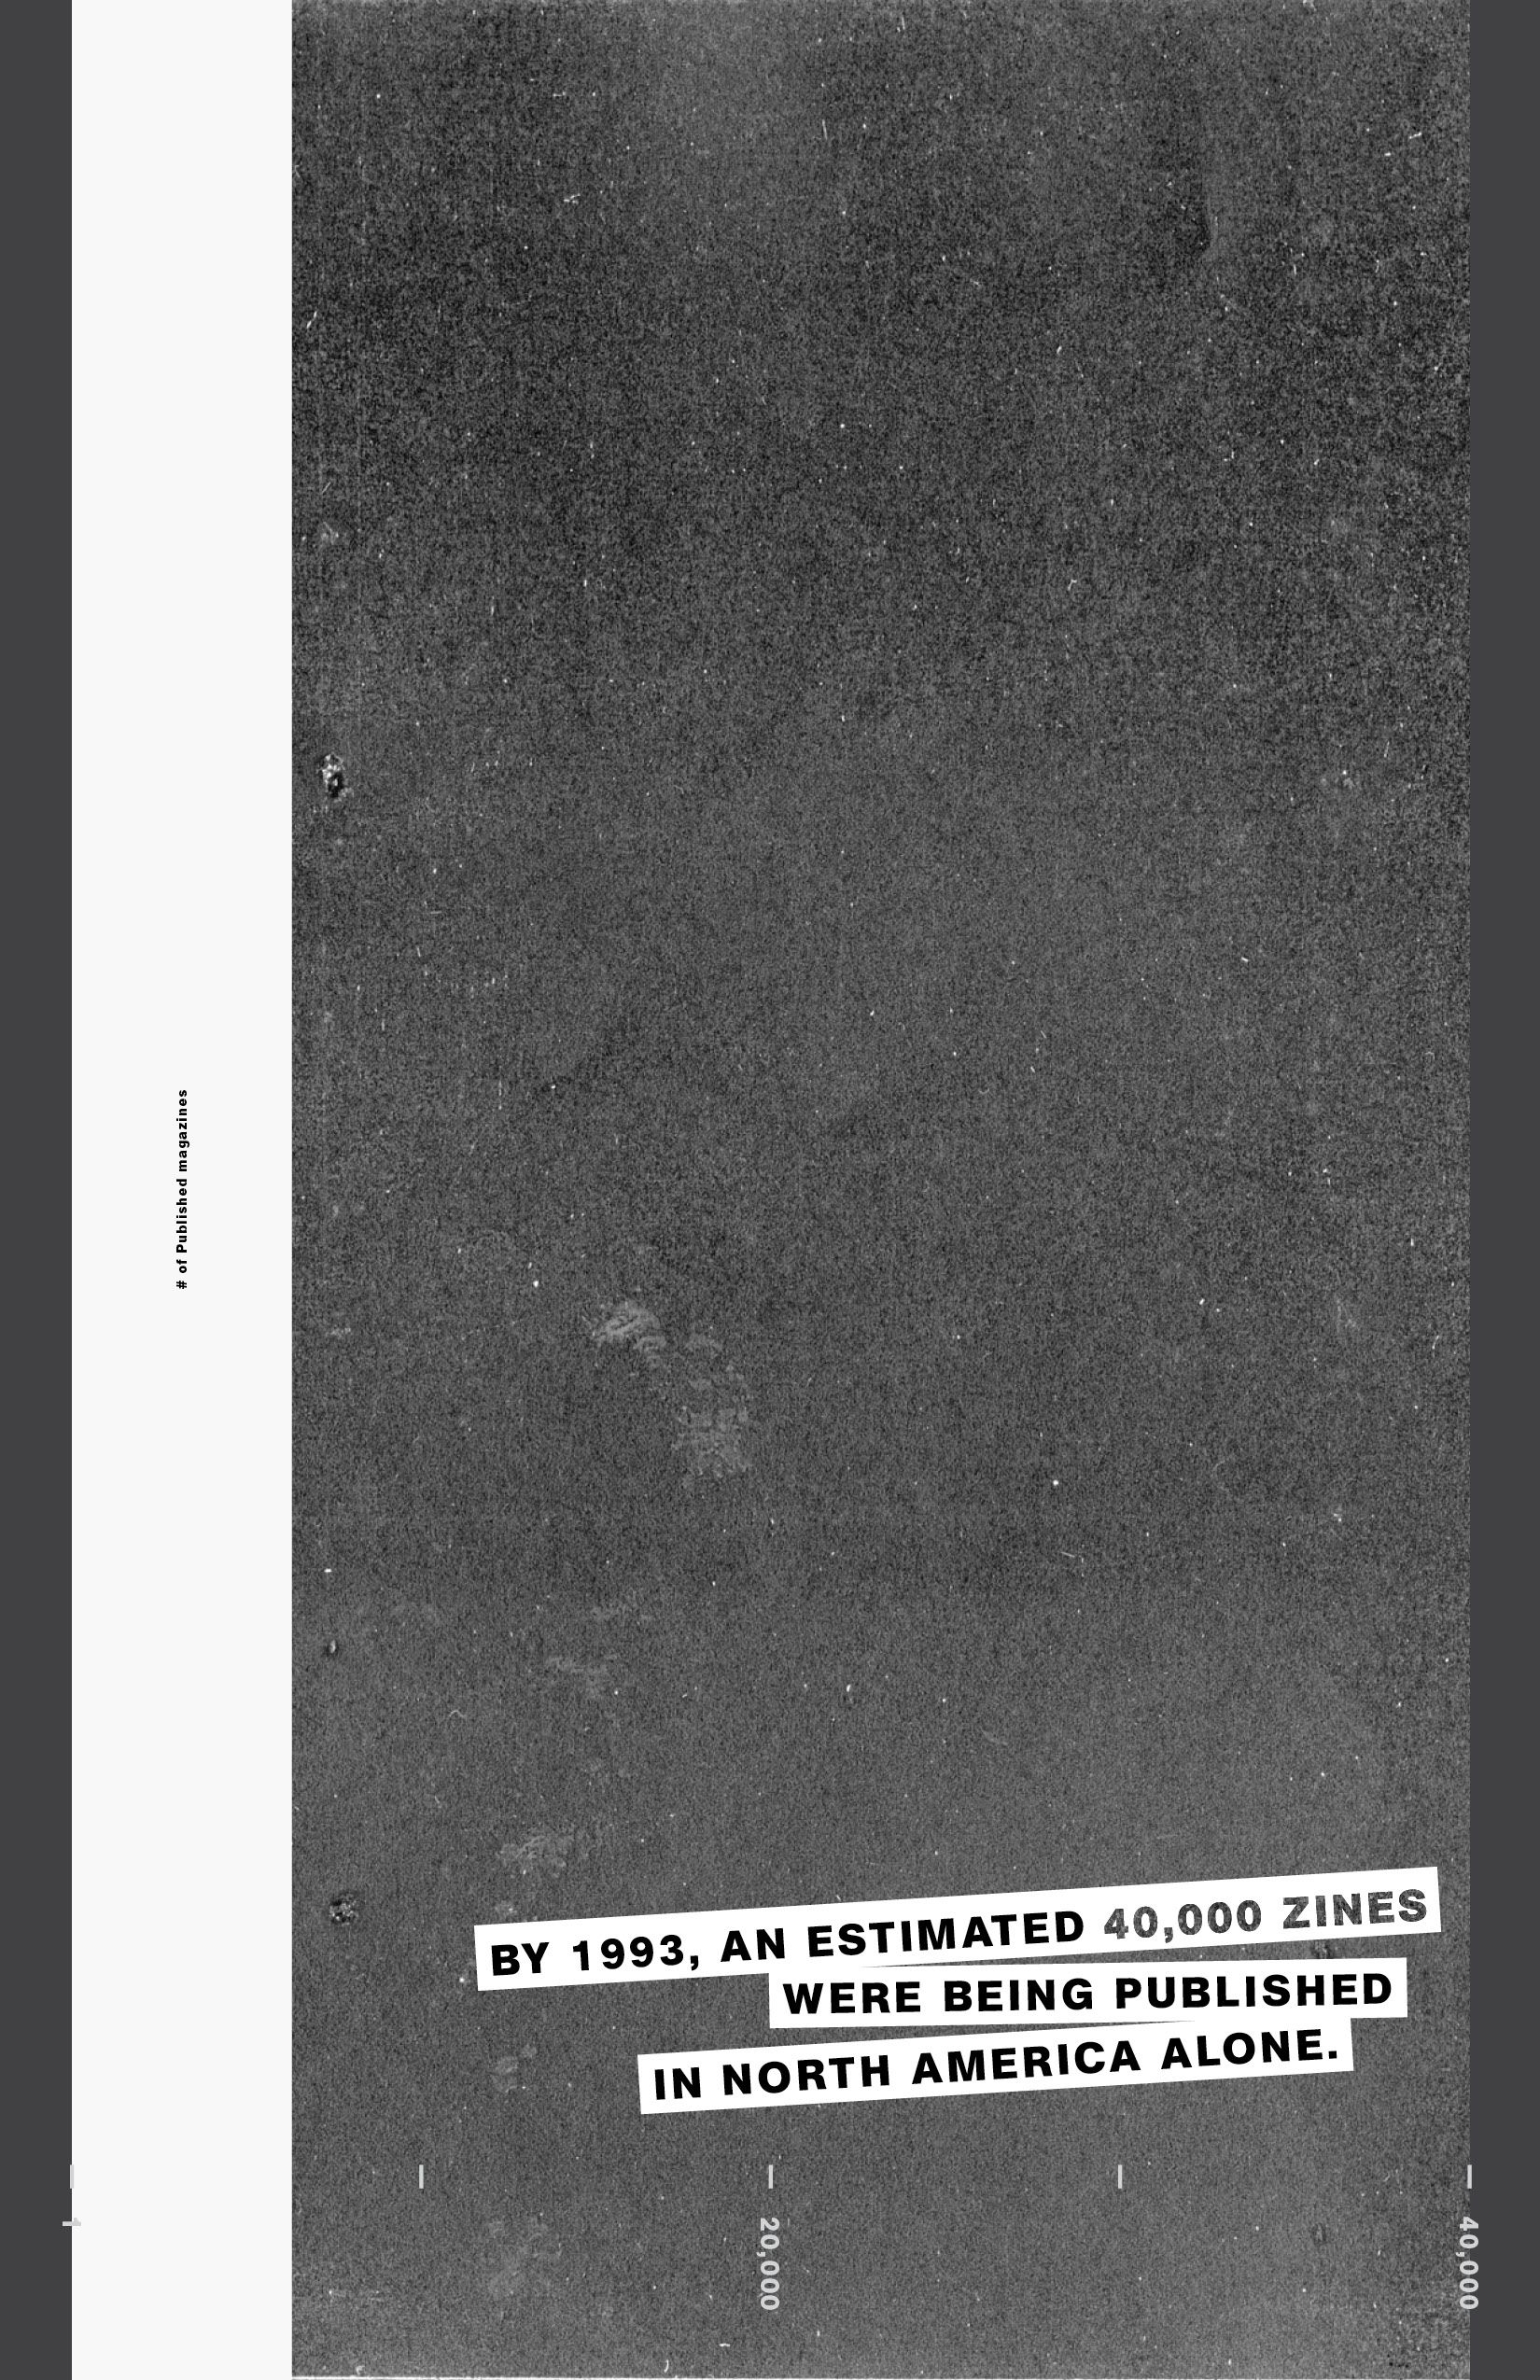
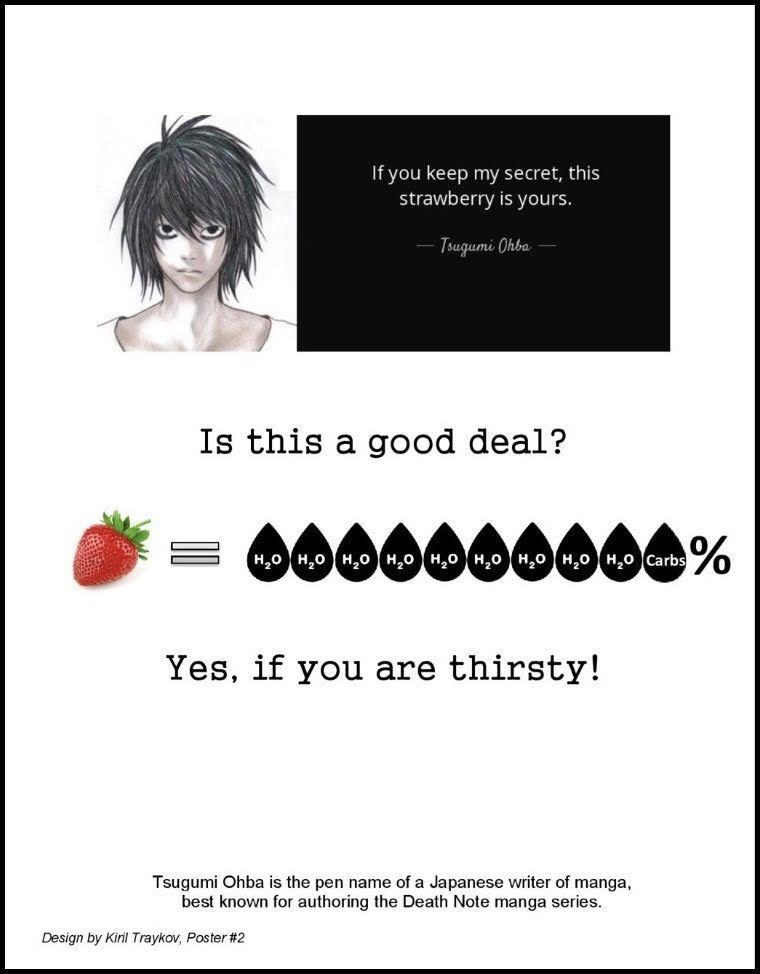
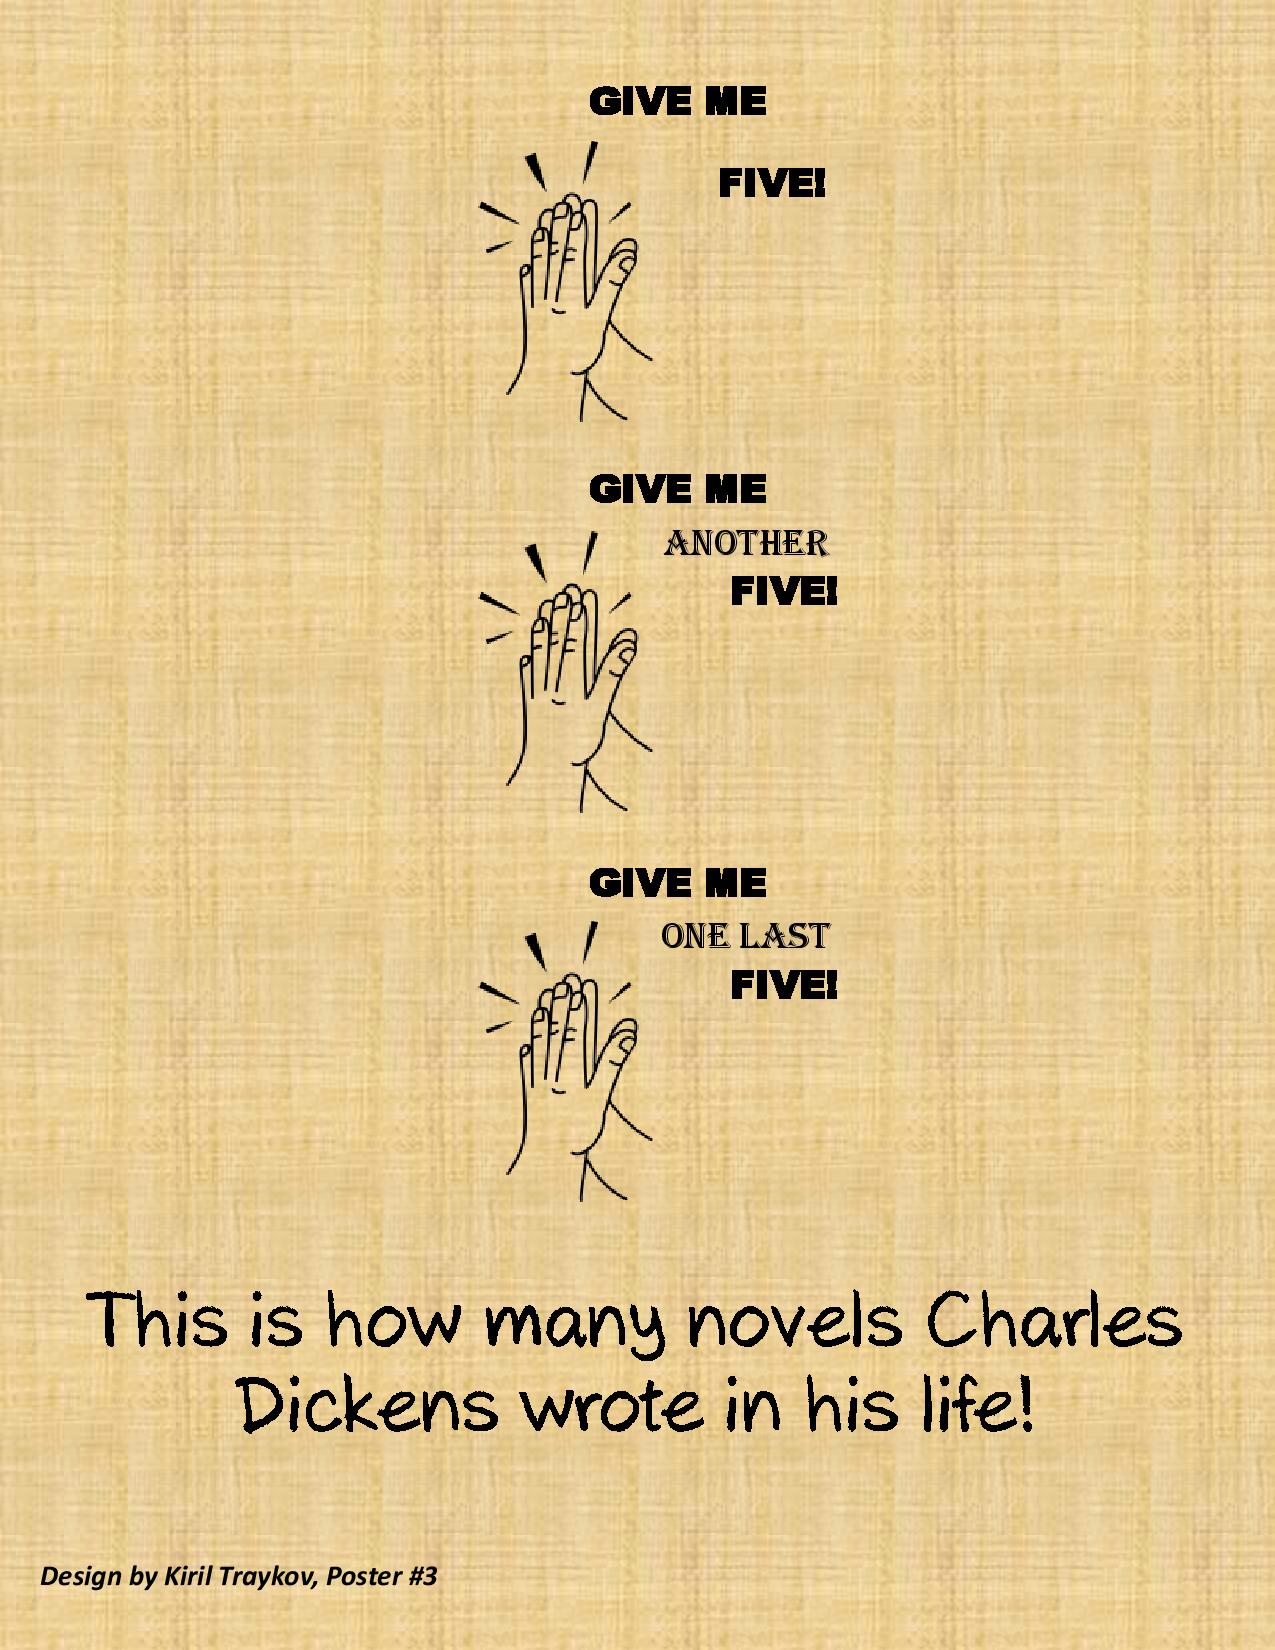
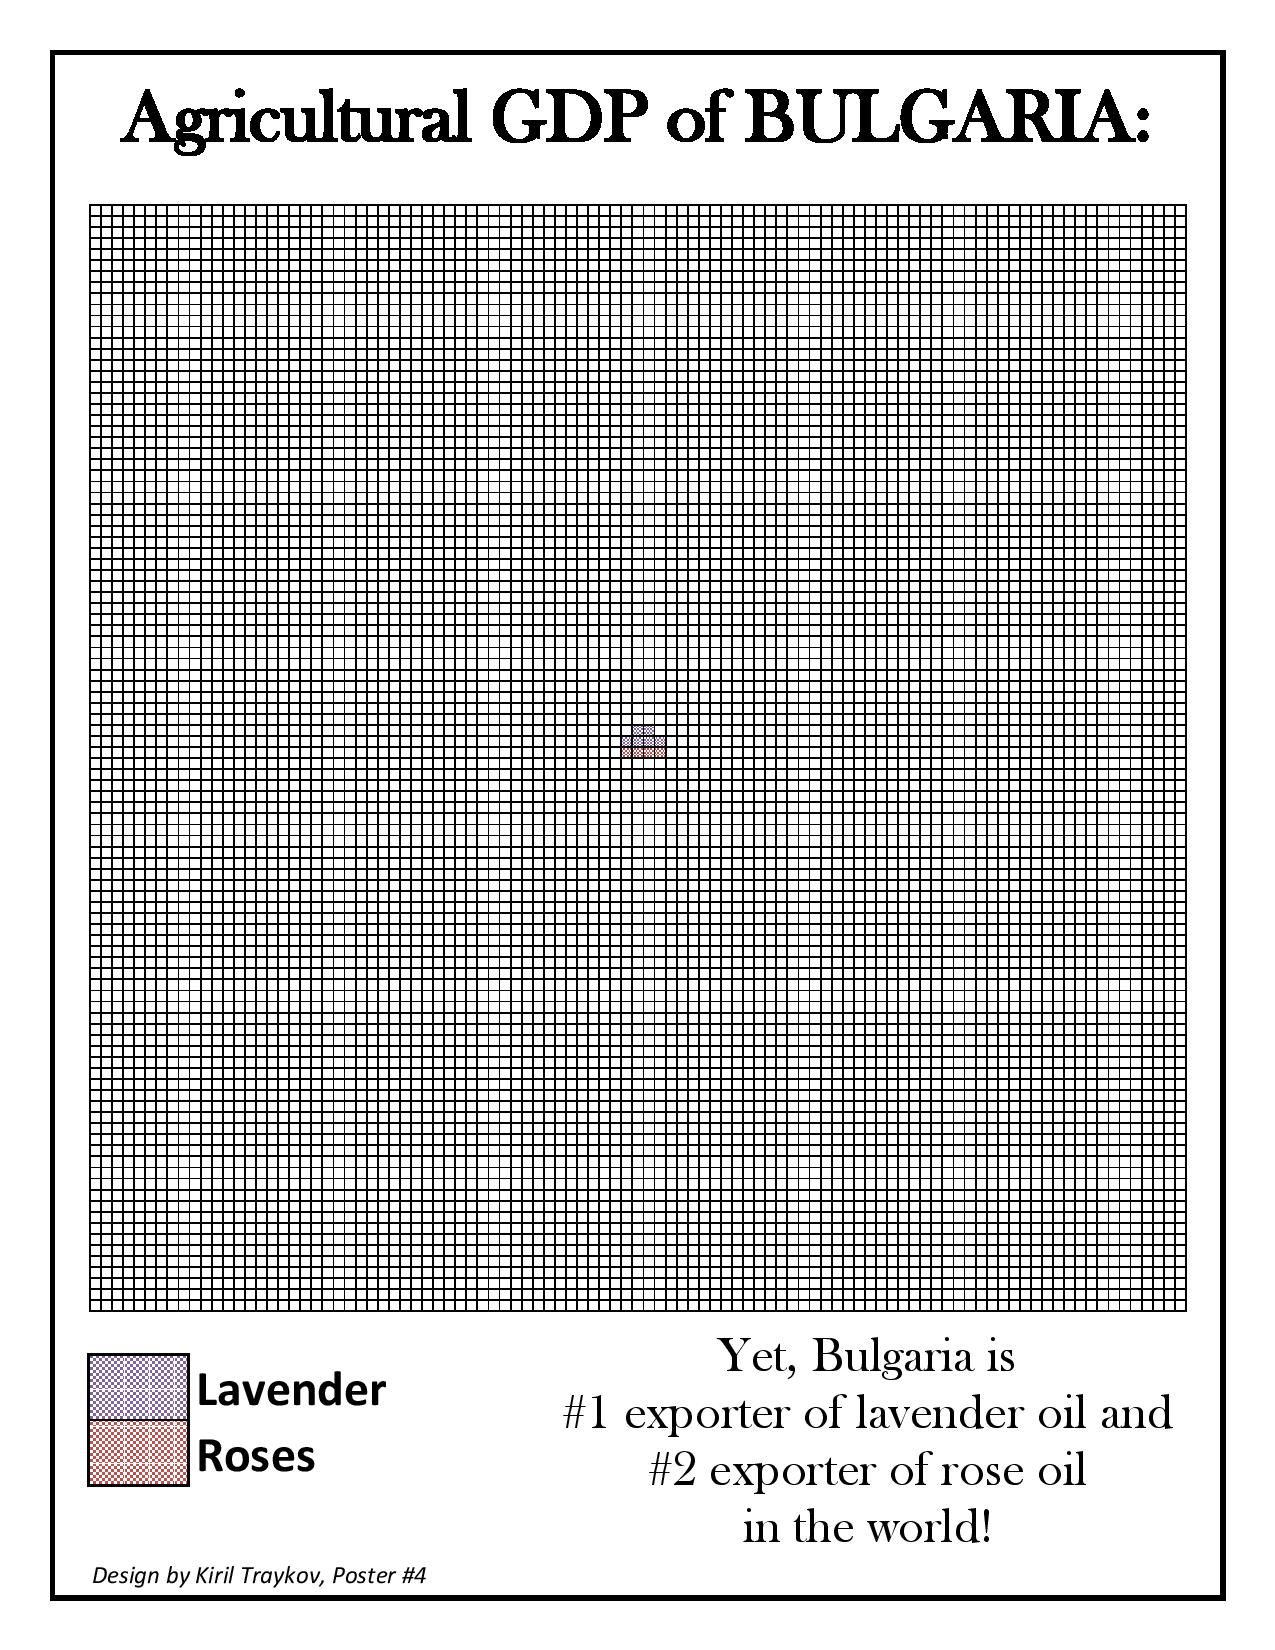
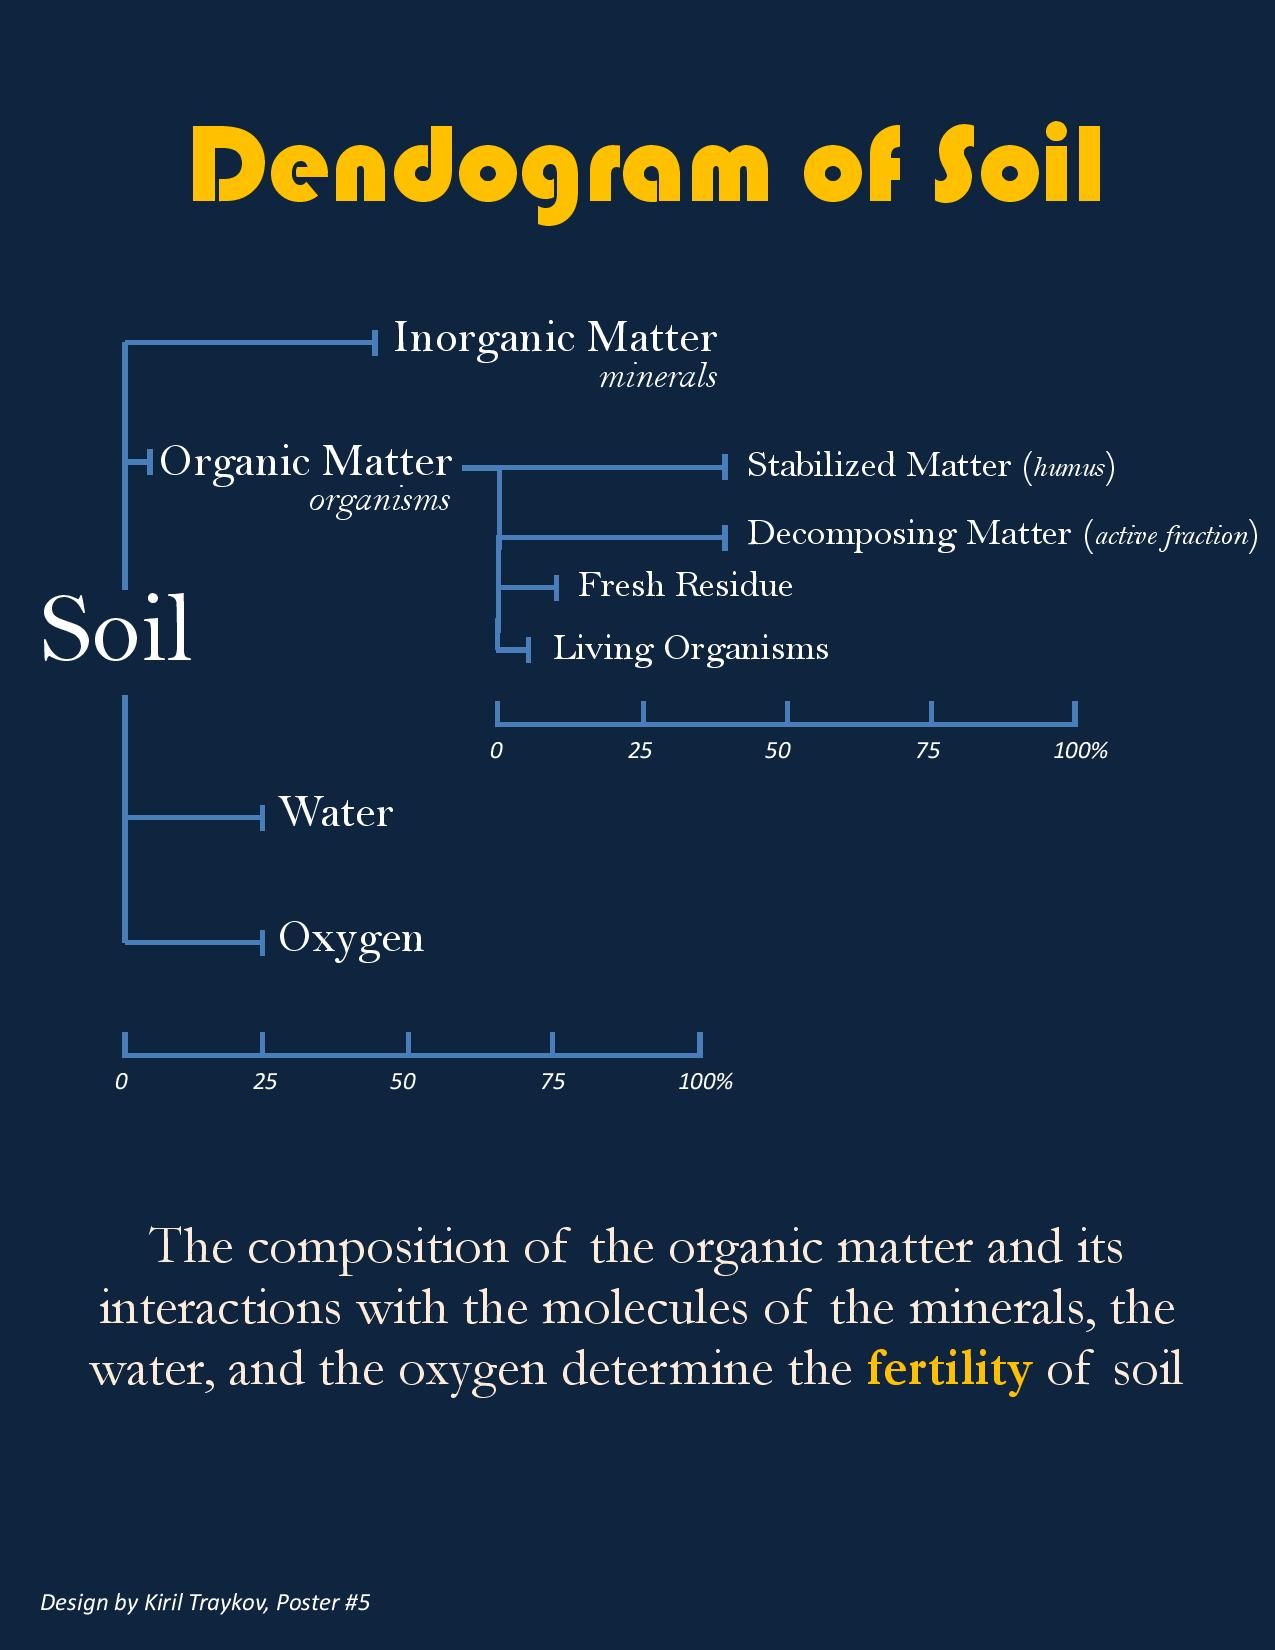
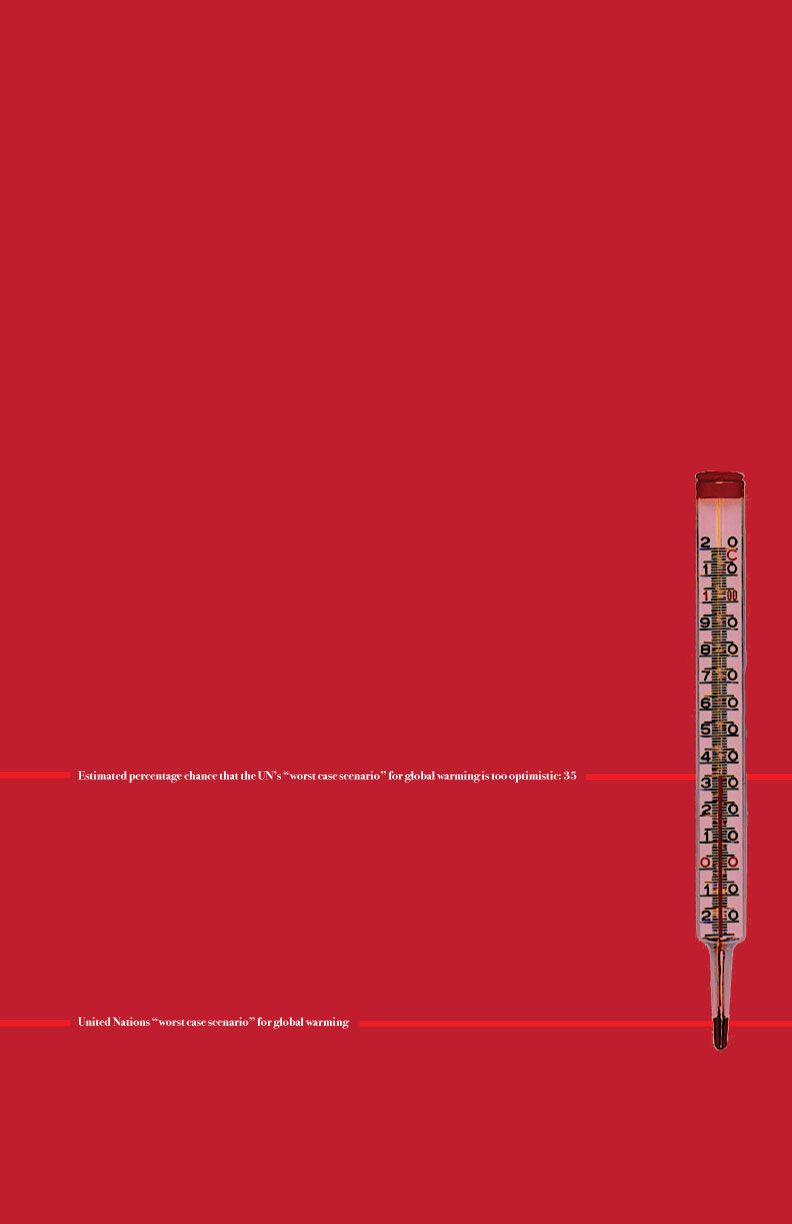
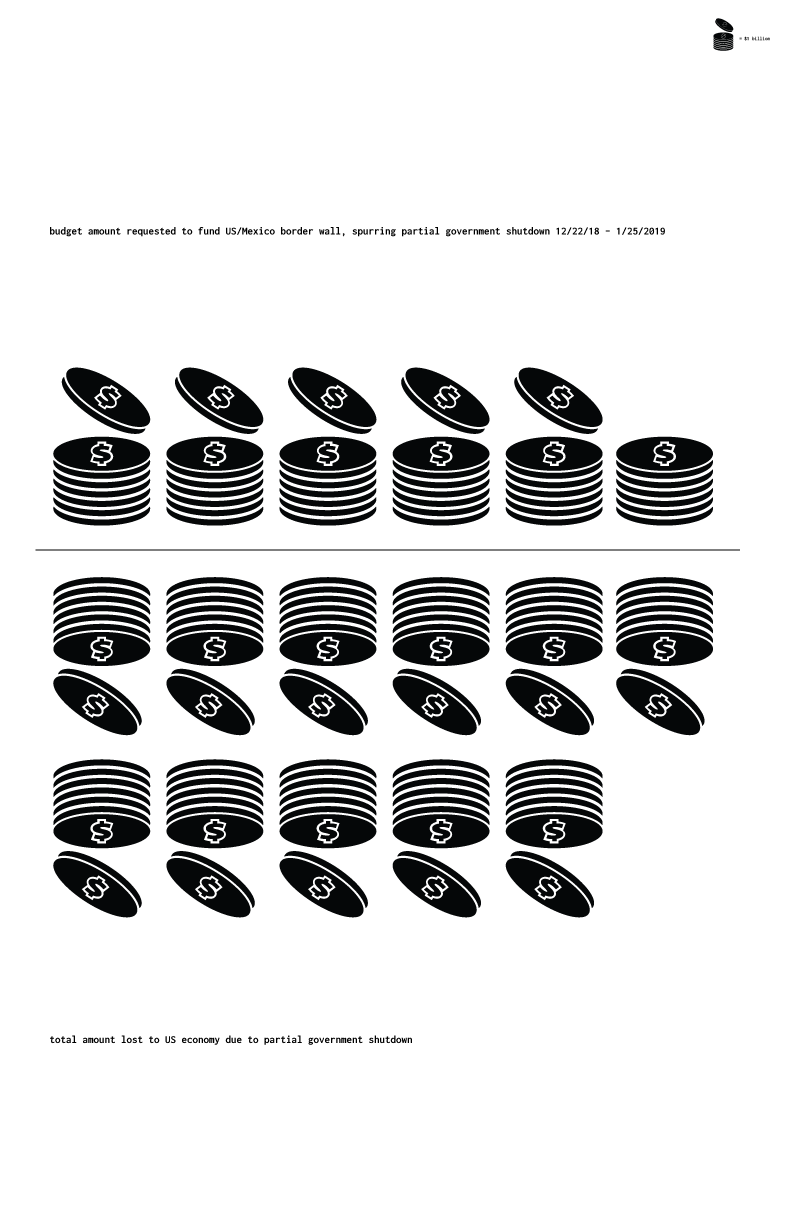
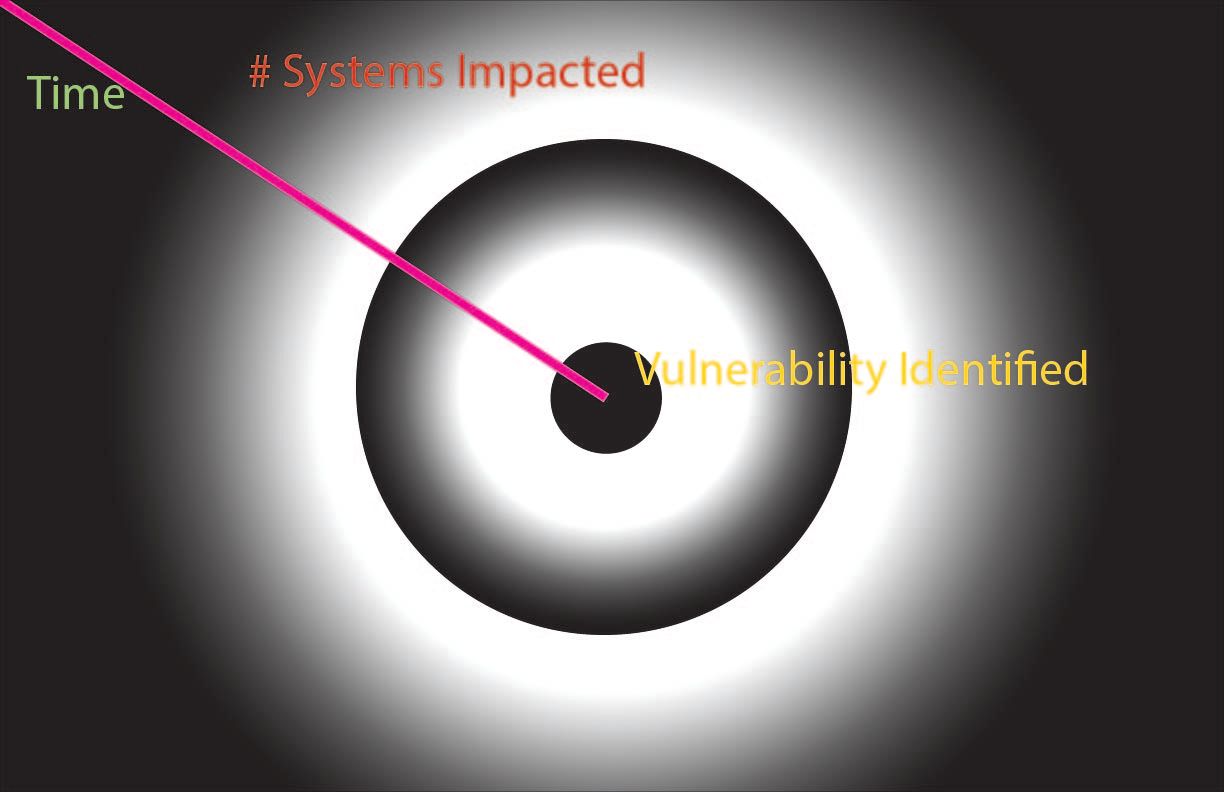
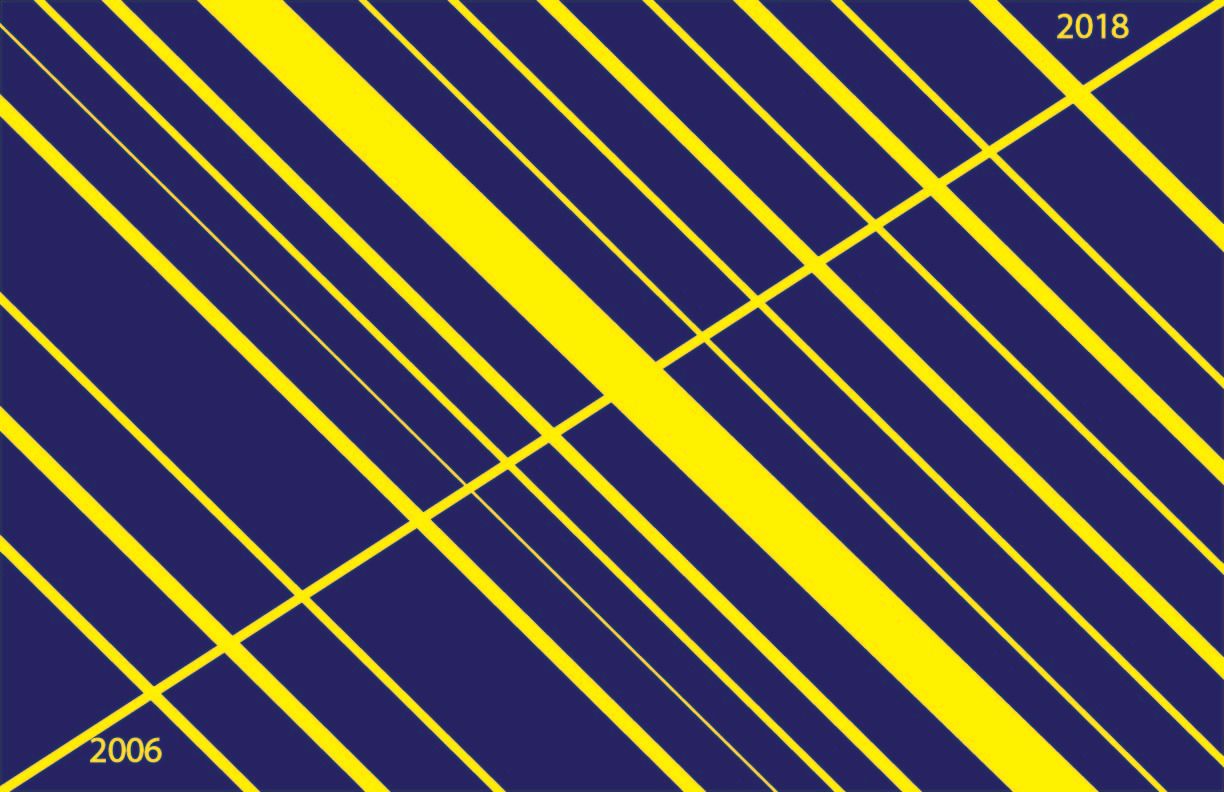
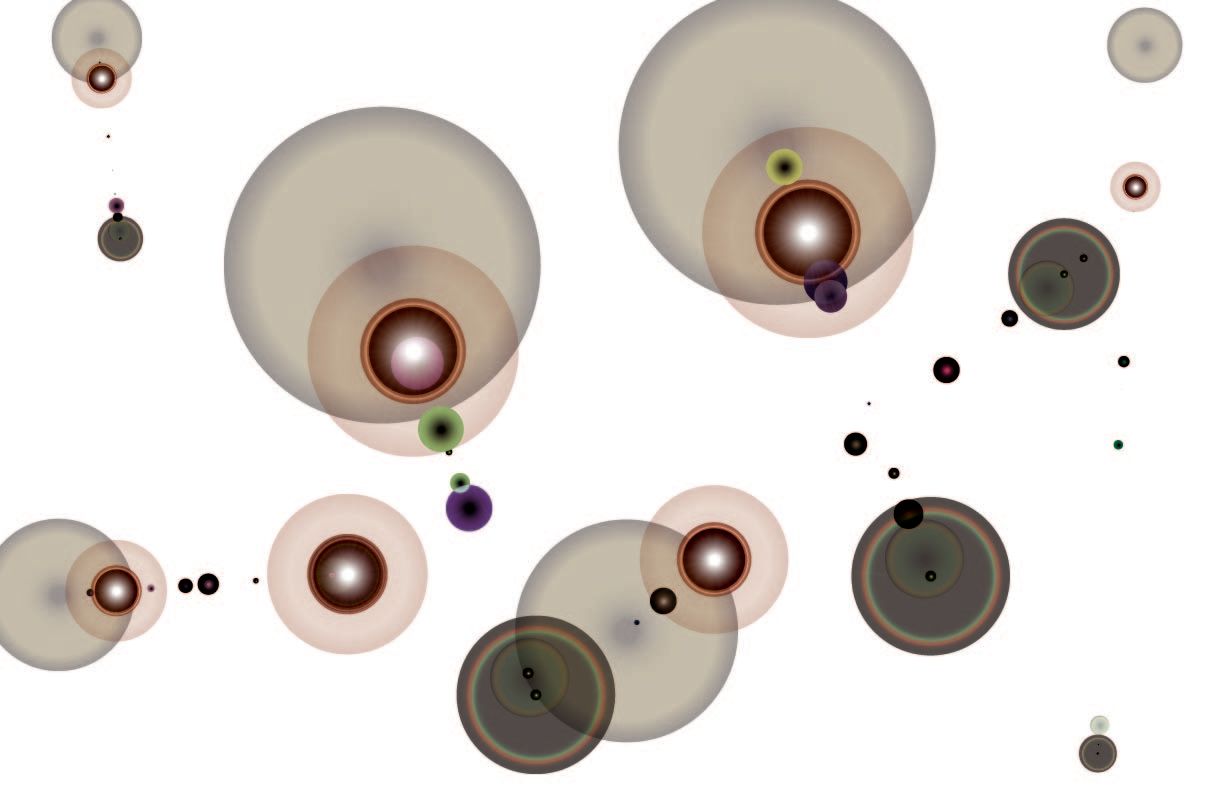
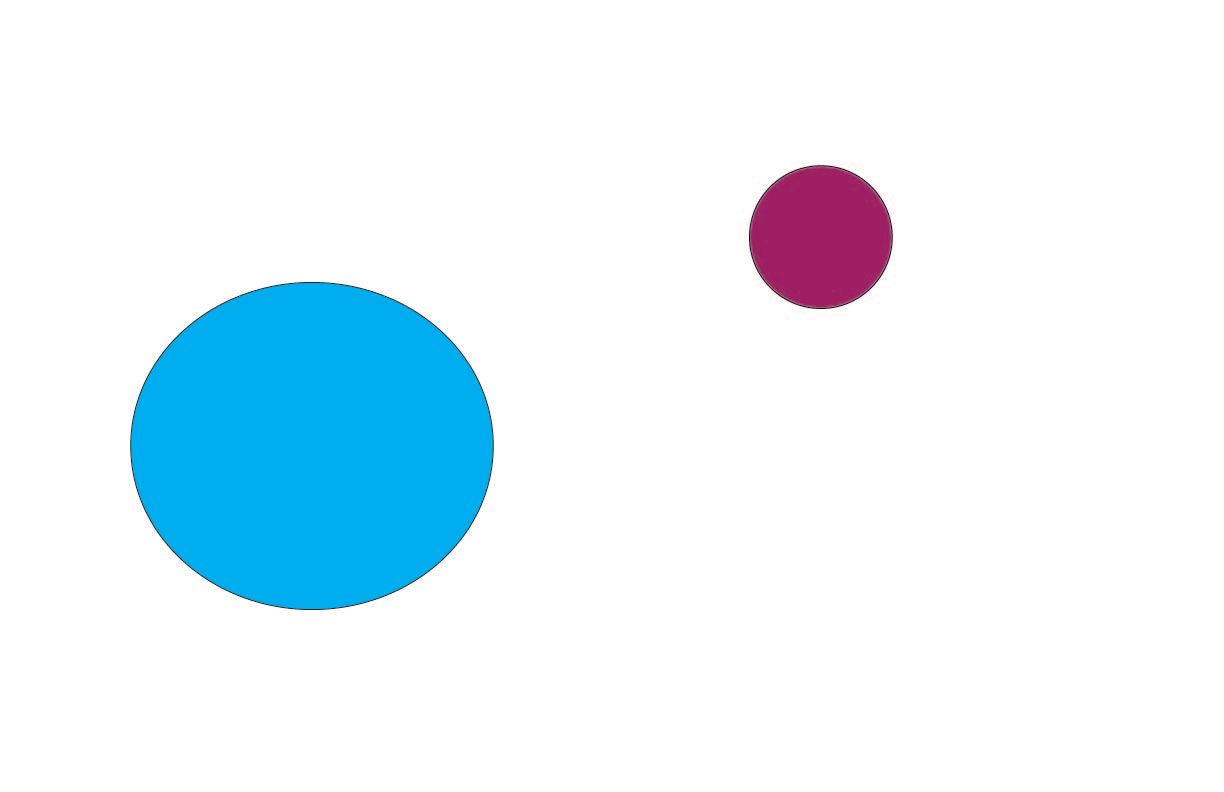
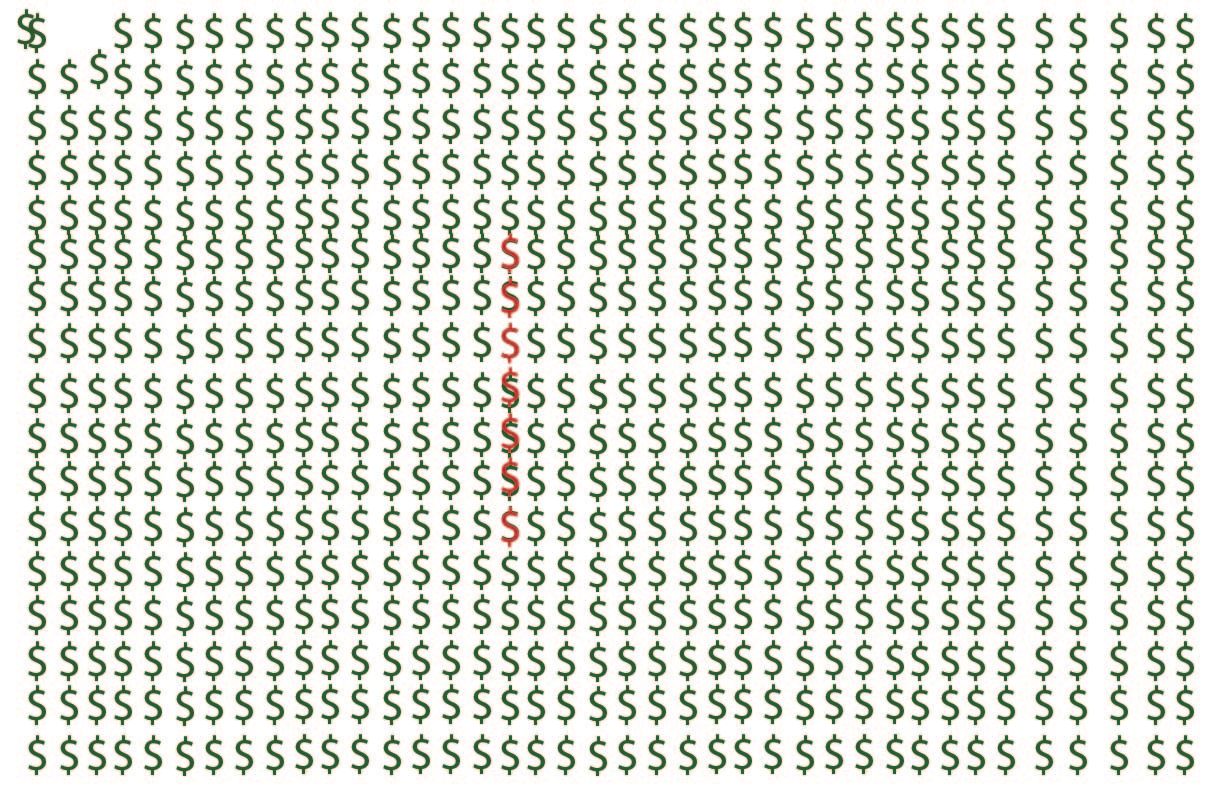
Each day, find a single number from a different subject area that interests you. For each, create a visual representation of that number using one of the seven retinal variables defined by Jacques Bertin (Position, size, shape, value, hue, orientation, texture) to encode its value—use a different retinal variable on each poster.

The poster must include a visual representation of the number and a reference to the data source. You can add additional text or formal elements (e.g., lines, shapes, gradients) if necessary, but refrain from using photography. The poster should be visually pleasing and should communicate well. Composition, form, typography, and color should fit with the subject matter. Each day, upload your design to the website. On Tuesday, bring your 7 posters to class and pin them up.

Be ready to answer why you chose the number and subject area. For each graphic decision, think about why you are doing it? Is it the best way to display the number?

This is an iterative warm-up exercise that you will also use to find subject areas you are interested in for your final project. Consider a broad range of topics but move quickly and step lightly—there will be plenty of time for overthinking things later on!

References

BBC×365
Interactive Type

Details

Format: 11 × 17" (landscape or portrait orientation).
Data: One number (and as many other values as are necessary to contextualize it) per poster plus a URL identifying your source.
Due: Online each day between 23 and 29 January. Printed on 29 January.

First steps

Log into your account on the course website and create a new post. Give it a title along the lines of “7 Numbers” (it won't be displayed publicly—think of it more as a  filename). Type the word Wednesdayinto the main body text of the post.

Next, click on the gear icon in the upper righthand corner of the screen and find the text field labeled  tags. Start typing the text seven numbers into the field then select the "Seven Numbers" item from the autocomplete menu—this allows for everyone's work to be seen on a single page.

Now close the sidebar and click the publish link just to the left of the gear icon. This will change the link's text to update and you can click it again to save your changes when you come back and add images of your posters every day this coming week. For now, try uploading a random image as a placeholder below where you typed “Wednesday” before. Once you've created your first poster you can swap it in for the placeholder image.

For each day, add a bit more content to your post with the following elements:

  1. The name of the day of the week
  2. A jpeg or png of your poster design (ideally try to scale it to 1,000–2,000 pixels wide in its longest dimension)
  3. A line of text describing the data source where you found your number and a hyperlink pointing to its URL.
Consult the Ghost Editor Overview for an explanation of how to include images, format your text, and include links.

caitlyn ralph

v a r i a b l e s

  • position ✅
  • size ✅
  • shape ✅
  • value ✅
  • hue ✅
  • orientation ✅
  • texture ✅

t u e s d a y

I also wrote down horror movies on a sticky note, and one of my favorite numbers in that realm is 7194/1—how much Paranormal Activity profited, making it the most profitable movie of all time (it took only $15,000 to create). Source. I represented this through the position variable, showing how much higher up on the number line Paranormal Activity is compared to the next five most profitable movies.

m o n d a y

Apparently, the average American throws away 80 pounds of used clothing each year. Source. Thrift clothing was a topic I wrote down on a sticky note, so I decided to represent that number through the size variable, compounding small "80 pound" (80 pixel by 80 pixel) circles adding up to one big circle (aiming to emphasize the problem).

s u n d a y

continuing with the topic of touring, a band i like has 33 upcoming concerts. source. i represented this through texture. each date is a line, each section is a month, and the more textured areas translate to clusters of tour dates.

s a t u r d a y

switching to some larger numbers outside of my daily life, one of the areas i'm interested in from a data perspective is touring schedules and venue sizes. brooklyn steel (a venue in east williamsburg) has a capacity of 1,800 people. source. i decided to represent this with the color value retinal variable, through a thermostat-style scale and iconography.

f r i d a y

today, i flew to portland, oregon (this is quickly becoming a diary of my life?). my arrival time was 11:05 am PST. not sure if time as a number was on the table for this assignment, but i've decided to run with it anyway (ask for forgiveness not permission?) because it's a visualization i've recently found intriguing. using inspiration from our first assignment in data viz and info aesthetics last semester, i decided to visualize that time using the color hue retinal variable.

t h u r s d a y

a lot of my ideas usually center on music because it's my favorite type of data to work with. on wednesday night, i saw an artist called king princess in brooklyn. she's arguably one of the most talked about new artists going into 2019 (no. 2 on bbc radio 1's new sounds 2019, slots on basically all the major us festivals this year). she's also just turned 20. i decided to use that number and represent it through orientation for today's poster.

w e d n e s d a y

one of the ideas i was interested in during our sticky note exercise was new york city transportation. with that in mind, for the first day of the exercise, i decided to keep it simple and pull a number from my commute. i ride the L train for 7 stops to work. using the retinal variable shape, here's my poster that represents that number, the square being my final destination.

Clare Churchouse

wednesday

15.77% of the artworks in The Metropolitan's Modern and Contemporary Art Collection are by women (2,027 out of the total 14,350 artworks are by women and 10,829 are by men = 12,856 artworks. Here not including the 1,494 that are ‘unknown’ maker, or the artwork is by a named artist whose gender is not yet identified, or by an artist couple/collaborative with both women and men). Shape

source: Met csv Jan 2018, artists in the Met's Modern & Contemporary Art Collection identified by gender

thursday

Earth's largest ice sheet, Antarctica, lost 219 billion tons of ice annually in 2012 – 2017, approx. triple the melt rate of the previous decade. Rate measured in tons of ice. Ice Sheet Mass Balance Inter-Comparison Exercise, 80 scientists from NASA and the ESA. Size

source: The Antarctic Report

friday

Artworks listed by the name of the artist in The Met's Modern & Contemporary Art Collection whose makers are identified by gender. 12,856 artworks are by either women or men, many artists have multiple artworks in the collection - here every name is listed, many therefore are listed multiple times. Separated into artists who are women and artists who are men. Value

source: Met csv Jan 2018, artists in the Met's Modern & Contemporary Art Collection identified by gender

saturday

NYC flood hazard mapper shows areas vulnerable to flooding from 1% annual chance storm (FEMA’s Preliminary Flood Insurance Rate Maps (PFIRMs) released in 2015 as part of a citywide flood map update, 1% annual chance storm also known as the Special Flood Hazard Area or 100-year floodplain.) The source mapper shows areas vulnerable to flooding, and displays water height rises predicted for future decades. Position

source: NYC flood hazard mapper

sunday

15,039 artists in MoMA csv data on kaggle. For those artists identified by MoMA in the dataset (80%), 65% are artists who are men, 15% are artists who are women. Color

source: MoMA artists csv on kaggle

monday

There are 105 different media classifications for artwork in the Modern & Contemporary Art Collection in The Met. For media classifications with more than ten artworks, women are collected more than men in only 5 media - all of the 5 categories are textile-related media. Texture

source: Met csv Jan 2018, artists in the Met's Modern & Contemporary Art Collection

tuesday

Of the 12,904 artworks whose makers are identified by nationality through the artist display bio column, 5 artworks are by Chinese artists. Orientation

source: Met csv Jan 2018, artists in the Met's Modern & Contemporary Art Collection

Mio Akasako

Wednesday

Ethnoracial Diversity at Burning Man 2017 // Source: Black Rock City Census Report 2013 - 2017

Diversity at Burning Man 2017 represented as ratios of people using hue. Total people in picture = 30; white (Caucasian): 77.1%; orange (Asian): 5.6%; pink (Hispanic/Latino): 4.9%; blue (Other): 9.3% . Not pictured are groups too small to be represented with n = 30 (Middle Eastern/North African: 1.6%, Black: 1.0%, Native American: 0.5%).

Thursday

Vagal Nerve Innervation of the Gut-Brain Axis // Source: Breit et al, 2018. Front Psychiatry.

The vagus nerve is made up of 80% afferent fibers (fibers that communicate signals going from the periphery to the brain) and 20% efferent fibers (fibers that communicate signals going from the brain to periphery). Arrows are used to denote directionality (orientation).

Friday

Map of Peggy Gou's tour destinations in 2018 // Source: Resident Advisor

Peggy Gou, a South Korean DJ who quickly rose to fame after her first EP release in 2016,  played 124 shows around the world in 2018. The yellow dots mark the locations in which she played (data can be extracted by the position of the dots). The original sketch included flight paths from each location to another, but I decided to implement that at a later point, perhaps if I go ahead and make this map interactive.

Saturday

Sexual assault against women in the US // Source: National Sexual Violence Resource Center

A few numbers are depicted in this image. There are 10 women in this image, six adults and four children. In the US, 1 out of 3 women experience sexual violence during their lifetime--three women total are textured (3 out of 10 is ~1 out of 3). 1 out of 5 women will be raped at some point in their lives--two women are textured with vertical and horizontal lines. 1 out of 4 girls will be sexually abused before the age of 18--one girl is textured with horizontal lines.

Sunday

The amount of primary use required to take reusable bags below the global warming potential of HDPE bags without secondary reuse // Source: UK Environmental Agency

This image visualizes the amount of primary use required to take reusable bags below the global warming potential of HDPE bags without secondary reuse, by size of the circles. You would have to use a paper bag 3 times (light blue circle), a LDPE bag 4 times (orange circle), a non-woven PP bag 11 times (green cicle), and a cotton bag 131 times (dark blue circle).

Monday

Clothing and Textiles Exports in 2016 by 5 countries, as US thousands of $ // Source: World Integrated Trade Solution

I was curious about Guatemala's textiles industry, so decided to map out the country's top five exporting partners, as well as  how many US thousands of $ they were exporting to each country. I also then took Guatemala's top exporting partners, and mapped out who they were exporting textiles to and how much. The value of exports are represented by the value of pink (the scale is on the top and bottom of the rectangle). The lightest pink represents $0, and the darkest pink represents $10,000,000. The country is represented by categorical colors (both the country in question, on the left and right, and their exporting partners). For example, Guatemala's top exporting partner for textiles & clothing is the United States, at $1,189,141.59. The design and colors were inspired by traditional textiles of Latin America, and is meant to be aesthetically interesting while also conveying information, once the viewer understands the color values.

Tuesday

Types of intrinsically photosensitive retinal ganglion cells (ipRGCs) // Source: Quattrochi et al, 2018. J Comp Neurol.

There are six types of known intrinsically photosensitive retinal ganglion cells (ipRGCs). ipRGCs are specialized ganglion cells in the retina that express the photopigment melanopsin, and consequently are sensitive to light. They are known for non-image forming functions, such as the pupillary light reflex, and regulation of circadian rhythms. The different types of ipRGCs, M1 through M6, can be distinguished by their shape (or morphology). The different colors denote changes in stratification in the inner plexiform layer (IPL). Blue indicates stratification in the OFF layer, while the yellow indicates a dip back down to the ON layer after stratifying up to the OFF layer.

Ryan Best

Wednesday 1.23

Politics / Orientation

While 43 percent support the construction of a border wall — compared to 49 percent who oppose construction — only 7 percent of voters said that they support dedicating funding to a border wall if it was the only way to end the government shutdown.

-Politico

NOTE from Politico after original article posted:

The story originally reported that only 7 percent of voters said that they support dedicating funding to a border wall if it was the only way to end the government shutdown and 72 percent oppose. That question was not asked among all voters, but more narrowly among voters who said they oppose the construction of the border wall.

Thursday 1.24

Sports / Size

Rockets' James Harden hits 30-point mark for 21st straight game

-ESPN

Points scored in each game taken from Basketball Reference

Friday 1.25

Racial Justice / Hue

The new analysis by Columbia postdoctoral researcher Naomi Zewde looks at what kind of effect such a nest egg would have on our racial wealth gap. It’s a pretty stark divide: Zewde estimates that in 2015, the median white person aged 18 to 25 had a net worth of $46,000. The median black person, by contrast, had a median net worth of $2,900. That’s a ratio of 15.9: White young people were nearly 16 times richer than their black counterparts.

-Vox

Saturday 1.26

Culture / Position

Roma and The Favourite lead the pack [of 2019 Oscar nominees], with 10 nominations each. The two films will go up against one another in the Best Picture, Best Director, and Best Screenplay categories.

-Vox

Sunday 1.27

Mapping (Police Killings) / Value

According to Mapping Police Violence's dataset of police killings, 35 of New York's 62 counties had at least one of its citizen killed at the hands of the police from 2013 through 2018. Kings County (Brooklyn) saw the highest number of these victims with 25 killings. New York County (Manhattan) was close behind at 20. Read more about this data source here.

NOTE: This map was constructed using the free Map of New York with Counties - Single Color by FreeVectorMaps.com – a fully layered, editable vector map file. All maps come in AI, EPS, PDF, PNG and JPG file formats. County layers are not named. 2013 US Census Bureau data.

Monday 1.28

Politics / Texture

There were 7 senators that voted for both Trump's and the Democrat's competing bills to end the government shutdown on Thursday, January 24th – 6 republicans and 1 democrat. Both bills failed to pass, while the House passed a continuing resolution (CR) on Friday, January 25th, which re-opened the government temporarily for three weeks.

Senators that voted for Trump's plan are represented by groups of lines moving up and to the right, while senators that voted for the Democrat's plan are represented by groups of lines moving up and to the left. The 7 senators that voted for both are shown where both lines intersect.

Data from The New York Times

Tuesday 1.29

Financial Markets / Shape

216 of the 500 stocks within the S&P 500 index gained value on January 23, 2017 – the first full trading day after Trump was inaugurated. 284 stocks lost value throughout trading on that day.

NOTE: this is of the 500 stocks that in the Kaggle dataset for that day – the S&P500 actually contains 505 stocks. I determined whether a specific stock gained or lost value by comparing their open and close prices during that day of trading.

Data from Kaggle

Grace Martinez

Wednesday

Trash / Size
"The U.S. produces more than 30 percent of the planet’s total waste, though it is home to only 4 percent of the world’s population."
- The Frontier Group


Thursday

Moon / Position  
In total, there are 3 full supermoons on January 21, February 19 and March 21, 2019. Supermoons are moons that come extra close to Earth in its monthly orbit.
—EarthSky


Friday

Music / Orientation
Rock stars really do die young: study finds musicians die 25 years younger than average person.
—The Telegraph


Saturday

Astrology / Shapes
Scorpio is the most common astrology sign. Most Common to Least Common Zodiac Signs.
—Swint Friday


Sunday

Zines / Color
Zines are "do-it-yourself" print magazines that are self-published and usually low circulation. They are a popular medium for subcultures outside of the mainstream and thus hard to track. As a former zine maker myself (I used to do one as a teenager), I was curious how many kinds of zines are actually out there. Barnard College has a library of zines and has broken them down into 15 genres.
—Barnard College


Monday

Places to Live / Value
WalletHub drew upon the various findings of positive-psychology research in order to determine which among more than 180 of the largest U.S. cities is home to the happiest people in America. I looked at the top 5 Cities and how the ranking differs upon the community & environment versus income and employment.
—WalletHub


Tuesday

Zines / Texture
According to the Flavorwire, there were an estimated 40,000 zines being published in 1993 in North America. I found this number interesting in comparison to the largest amount of magazines ever circulated in the U.S. was 7,390 in 2012.  
—Flavorwire, Statistica

Kiril Traykov

Wednesday, January 23rd, Poster #1

Thursday, January 24th, Poster #2

Friday, January 25th, Poster #3

Saturday, January 26th, Poster #4

Sunday, January 27th, Poster #5

Monday, January 28th, Poster #6

Tuesday, January 29th, Poster #7

Jed Crocker

Wednesday: School lunch / Hue

source: https://www.marketplace.org/2019/01/23/world/schools-worry-shutdown-will-affect-lunch-programs

Thursday: Science funding / Value

sources: http://policy.asbmb.org/2019/01/10/government-shutdown-update-tallying-the-impact-on-national-science-foundation/ & https://en.wikipedia.org/wiki/Funding_of_science

Friday: Shutdown ends for now / Texture

source: https://en.wikipedia.org/wiki/2018%E2%80%9319_United_States_federal_government_shutdown

Saturday: Big win / Size

source: a middle school boys basketball game on January 26, 2019

Sunday: Global warming & optimism / Position

source: https://harpers.org/archive/2019/02/harpers-index-february-2019/

Monday: Something lost / Orientation

source: https://www.nytimes.com/2019/01/28/us/politics/shutdown-cost-us-economy-11-billion-cbo-says.html

source: my calendar at work for today / this week! 

Suzanna Schmeelk

Day Seven: Tuesday

Exploited vulnerabilities: 1/8 of 8K

Day Six: Monday

18 Biggest Data Breaches

Day Five: Sunday

SAMMAMISH, WA - The ransomware attack on the city of Sammamish continued through Thursday, and the city has hired a tech company to try to remedy the situation. The city is also working with law enforcement to track down the perpetrators.

Day Four: Saturday

"Earlier this year, a report from the InfoSec Institute revealed that women make up a paltry 11% of the cybersecurity workforce. ... Worse is the fact that women in IT still make considerably less than their male counterparts – there’s as much as a 20% gap in pay."   InfoSec original study link.

Day Three: Friday

EU GDPR Captures Google on Privacy: $33,700,000,000:$57,000,000

Day Two: Thursday

A Fed's Report 500:6

Day One: Wednesday

Transplants by Geographic Location

Day Zero: Tuesday

A funny number story:

Copyright 2003 by Randy Glasbergen

Isabel

Day 1 - Wednesday

9 out of the world's 10 most polluted cities are in India [value and color]

PM2.5 is a particle considered so small that it can enter the lungs and cause serious health problems - used as a standard to measure air quality. The WHO listed the most polluted cities in the world based on a comparison of the average amount of PM2.5 per cubic meter. The US average annual PM2.5 level is below 10 mcg per cubic meter. The city Kanpur in northern India has an annual level of 173 mcg per cubic meter. The WHO doesn’t treat its data as a ranking but rather a risk assessment. Urban India in that sense is one of the riskiest places to take a deep breath. See Vox covering WHO research (October 2018).


Day 2 - Thursday

The price of a cup of coffee in Venezuela is up 285,614% in a year [size and position]

Once one of Latin America's wealthiest countries, with the largest oil reserves in the world. Now in an economic and political crisis. Venezuela's inflation exceeded 1 million percent in 2018. The International Monetary Fund forecasted this would be 10 million percent during 2019. What does that kind of inflation even mean? Bloomberg created a gauge to measure the depreciation of bolivars in practice: the Cafe Con Leche Index. The index is tracking the price for just one item: a cup of coffee served at a standard bakery in eastern Caracas. By the end of 2018, the price of a coffee in Venezuela was 2,856 times more than in the year before.


Day 3 - Friday

In more than 50% of the fatal shooting cases in these cities, no one is arrested. [texture]

Buzzfeed and The Trace examined data from 202 urban police departments from 1980 until 2017. They found that arrest rates in murder or assault cases involving firearms have decreased since 1980. In many cities, more than 50% of fatal shootings do not lead to an arrest (distinguished from conviction). The arrest rate is even lower in shootings where the victim survives, or is black or hispanic.


Day 4 - Saturday

The European region has 7 main structures. [shape and hue] 

The largest structure is the Council of Europe; a human rights organization founded after WWII. The most cohesive set of 28 countries is the European Union (EU), and has within it the Eurozone containing the 19 countries using the euro currency. The Schengen area is an easy travel area that allows for border crossing without passport checks among 26 countries. Not every EU country is in the Schengen area and not every Schengen area country is in the EU. Some countries are not in the EU but still in EU's customs union or European Economic Area or both. The United Kingdom is in the process of leaving the EU club (Brexit). Since 2 years, the UK is deliberating what other European club it should join instead.


Day 5 - Sunday

The Hyperloop would make the commute from LA to San Fransisco in 35 minutes. [position]

In his 2013 open-source paper, Elon Musk claimed that hyperloop systems would be capable of traveling at speeds of up to 620mph (1,000km/h). Instead of a 6-hour car ride or 1.5 hour flight, the hyperloop would the LA-SF commute in 10% of the time. Since then, teams have been competing to make that come through. The latest record, made by German students, stands at a top speed of 284 miles per hour (457 kph) but... was with a 154-pound (70 kg) miniature scale hyperloop train as big as a skateboard. Richard Branson is betting on his Virgin Hyperloop One, and says it is running a full-scale test version of the hyperloop at 240 mph (386 kph).


Day 6 - Monday

The East Pacific Rise in the South Pacific is the fastest with 6 inches (15cm) per year. [direction and size]

Continents are on the move. The Mid-Atlantic Ridge near Iceland is migrating relatively slow, about 1 inch (2.5cm) per year, about the rate of fingernails growth. The East Pacific Plate moves about 6 times as fast. Africa is moving north. It will be sharing its borders with Europe, without a Mediterranean Sea in between as this will be replaced by a Himalayas-size mountain riff. The result is a huge African-European continent, one day (ok, in 50 million years). Based on the National Geographic video and maps from Geology.com.


Day 7 - Tuesday

Less than 25% of Indians are online (mobile or web), compared to 57% in China. [position and hue]

India is often compared to China, for its population and economic potential. One difference is the amount of Indians on the internet relative to the Chinese. India, along with Tanzania, is featured at the bottom of a ranking of the internet usage-to-population ratio, according to Pew Research Center’s findings. Low internet penetration is not only due to a lack of internet access, Quartz reports that language is an issue. Many Indians speak a language other than one of the main internet languages.