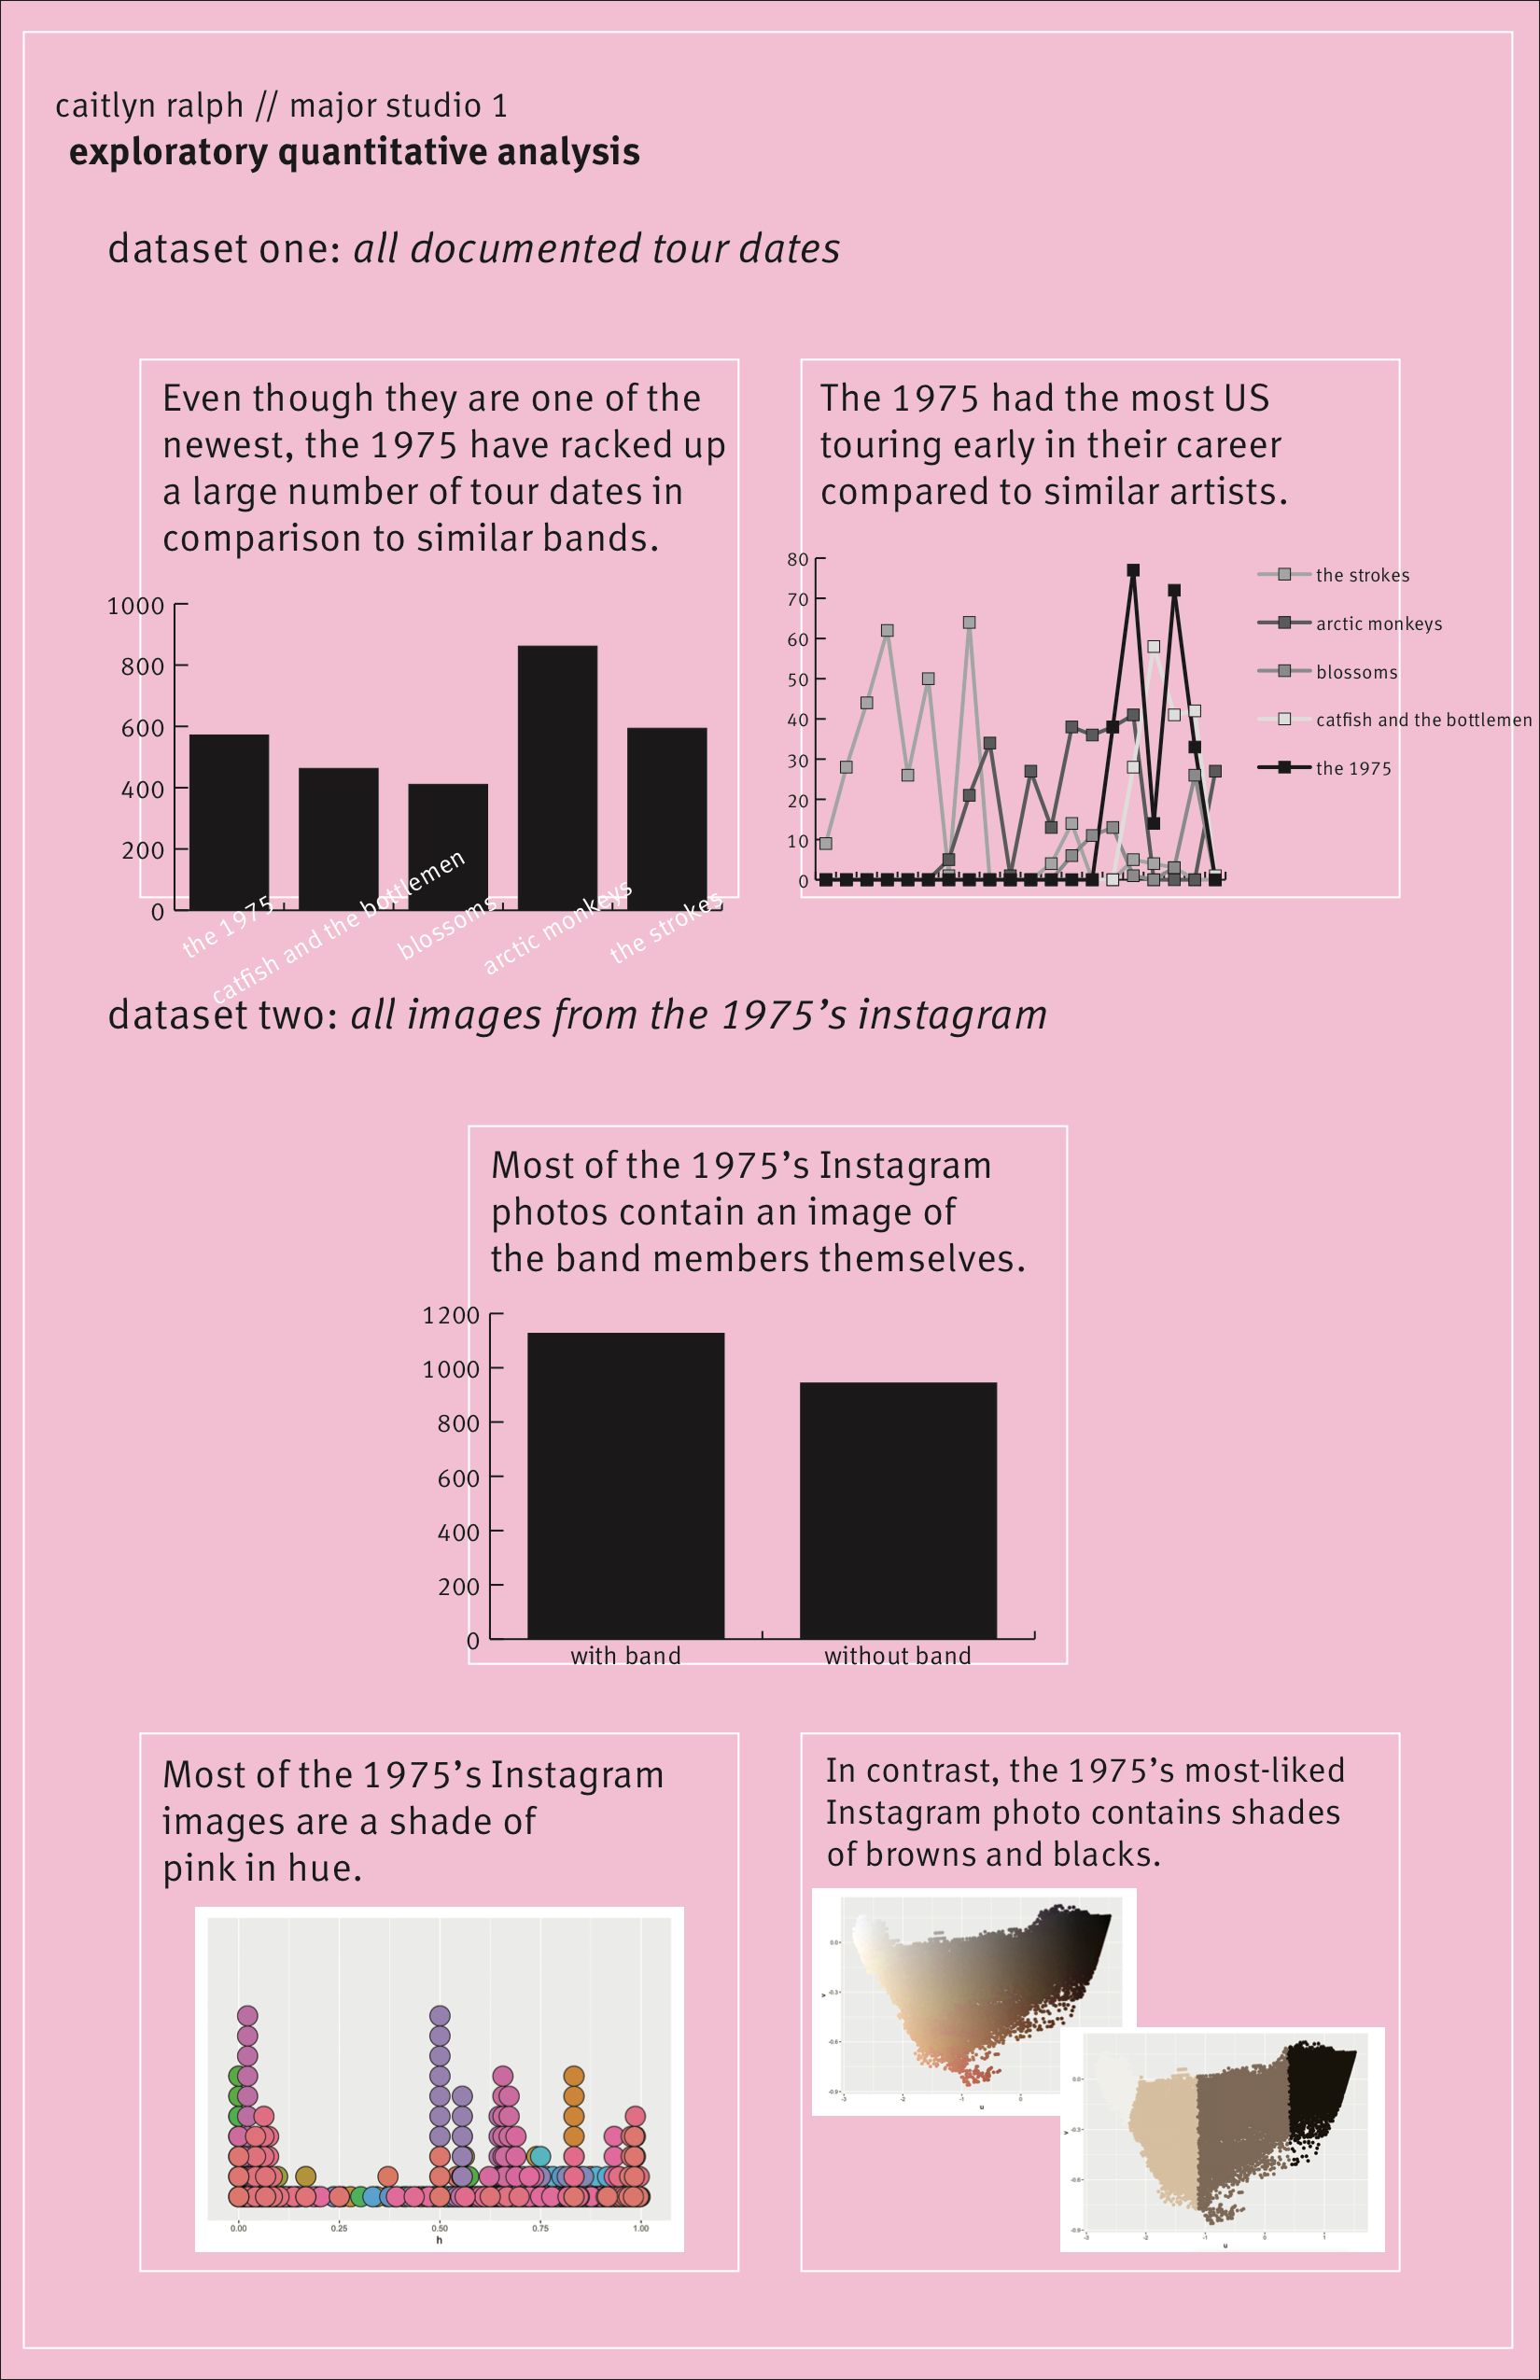
out of the sample quantitative viz i presented last week (number of US shows, number of total shows, number of Instagram photos with the band members, and two examples of color analysis), the one that appealed most was the number of shows the 1975 played and the distances they potentially traveled.
from this, i've decided the topic for my final quantitative poster would be an analysis of the 1975's touring history paired with their instagram posts to actually see what the tours looked like throughout time (which i realize is a qualitative measurement, but i feel like the poster is anchored by the quantitative visualization of the number of shows).
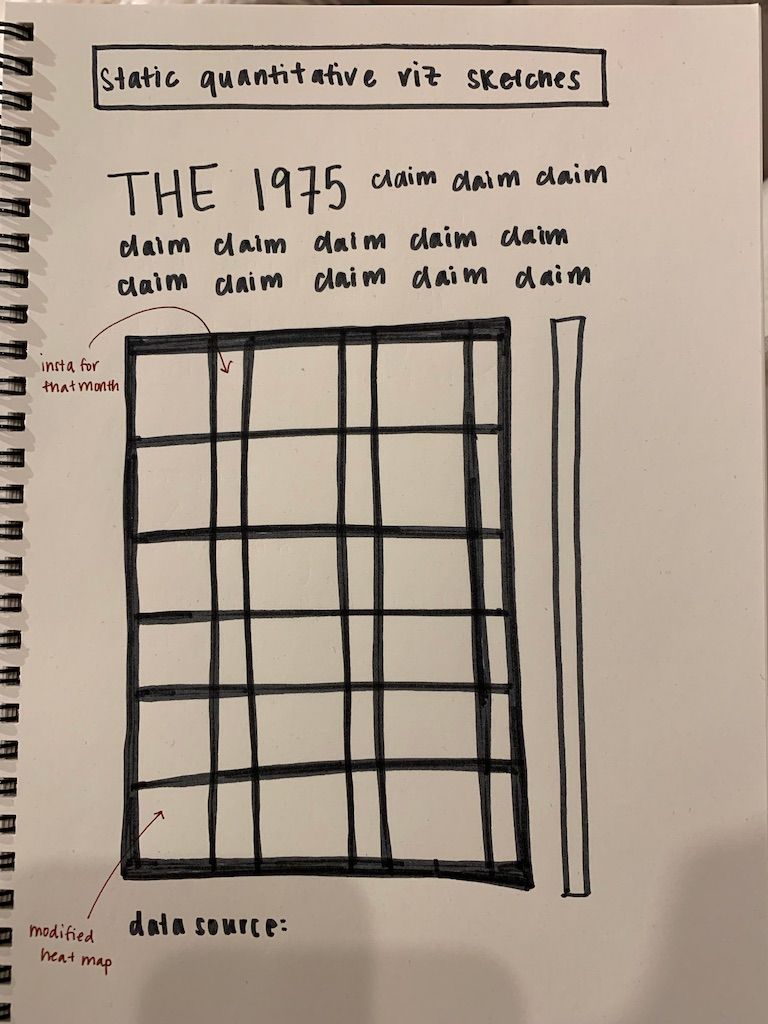
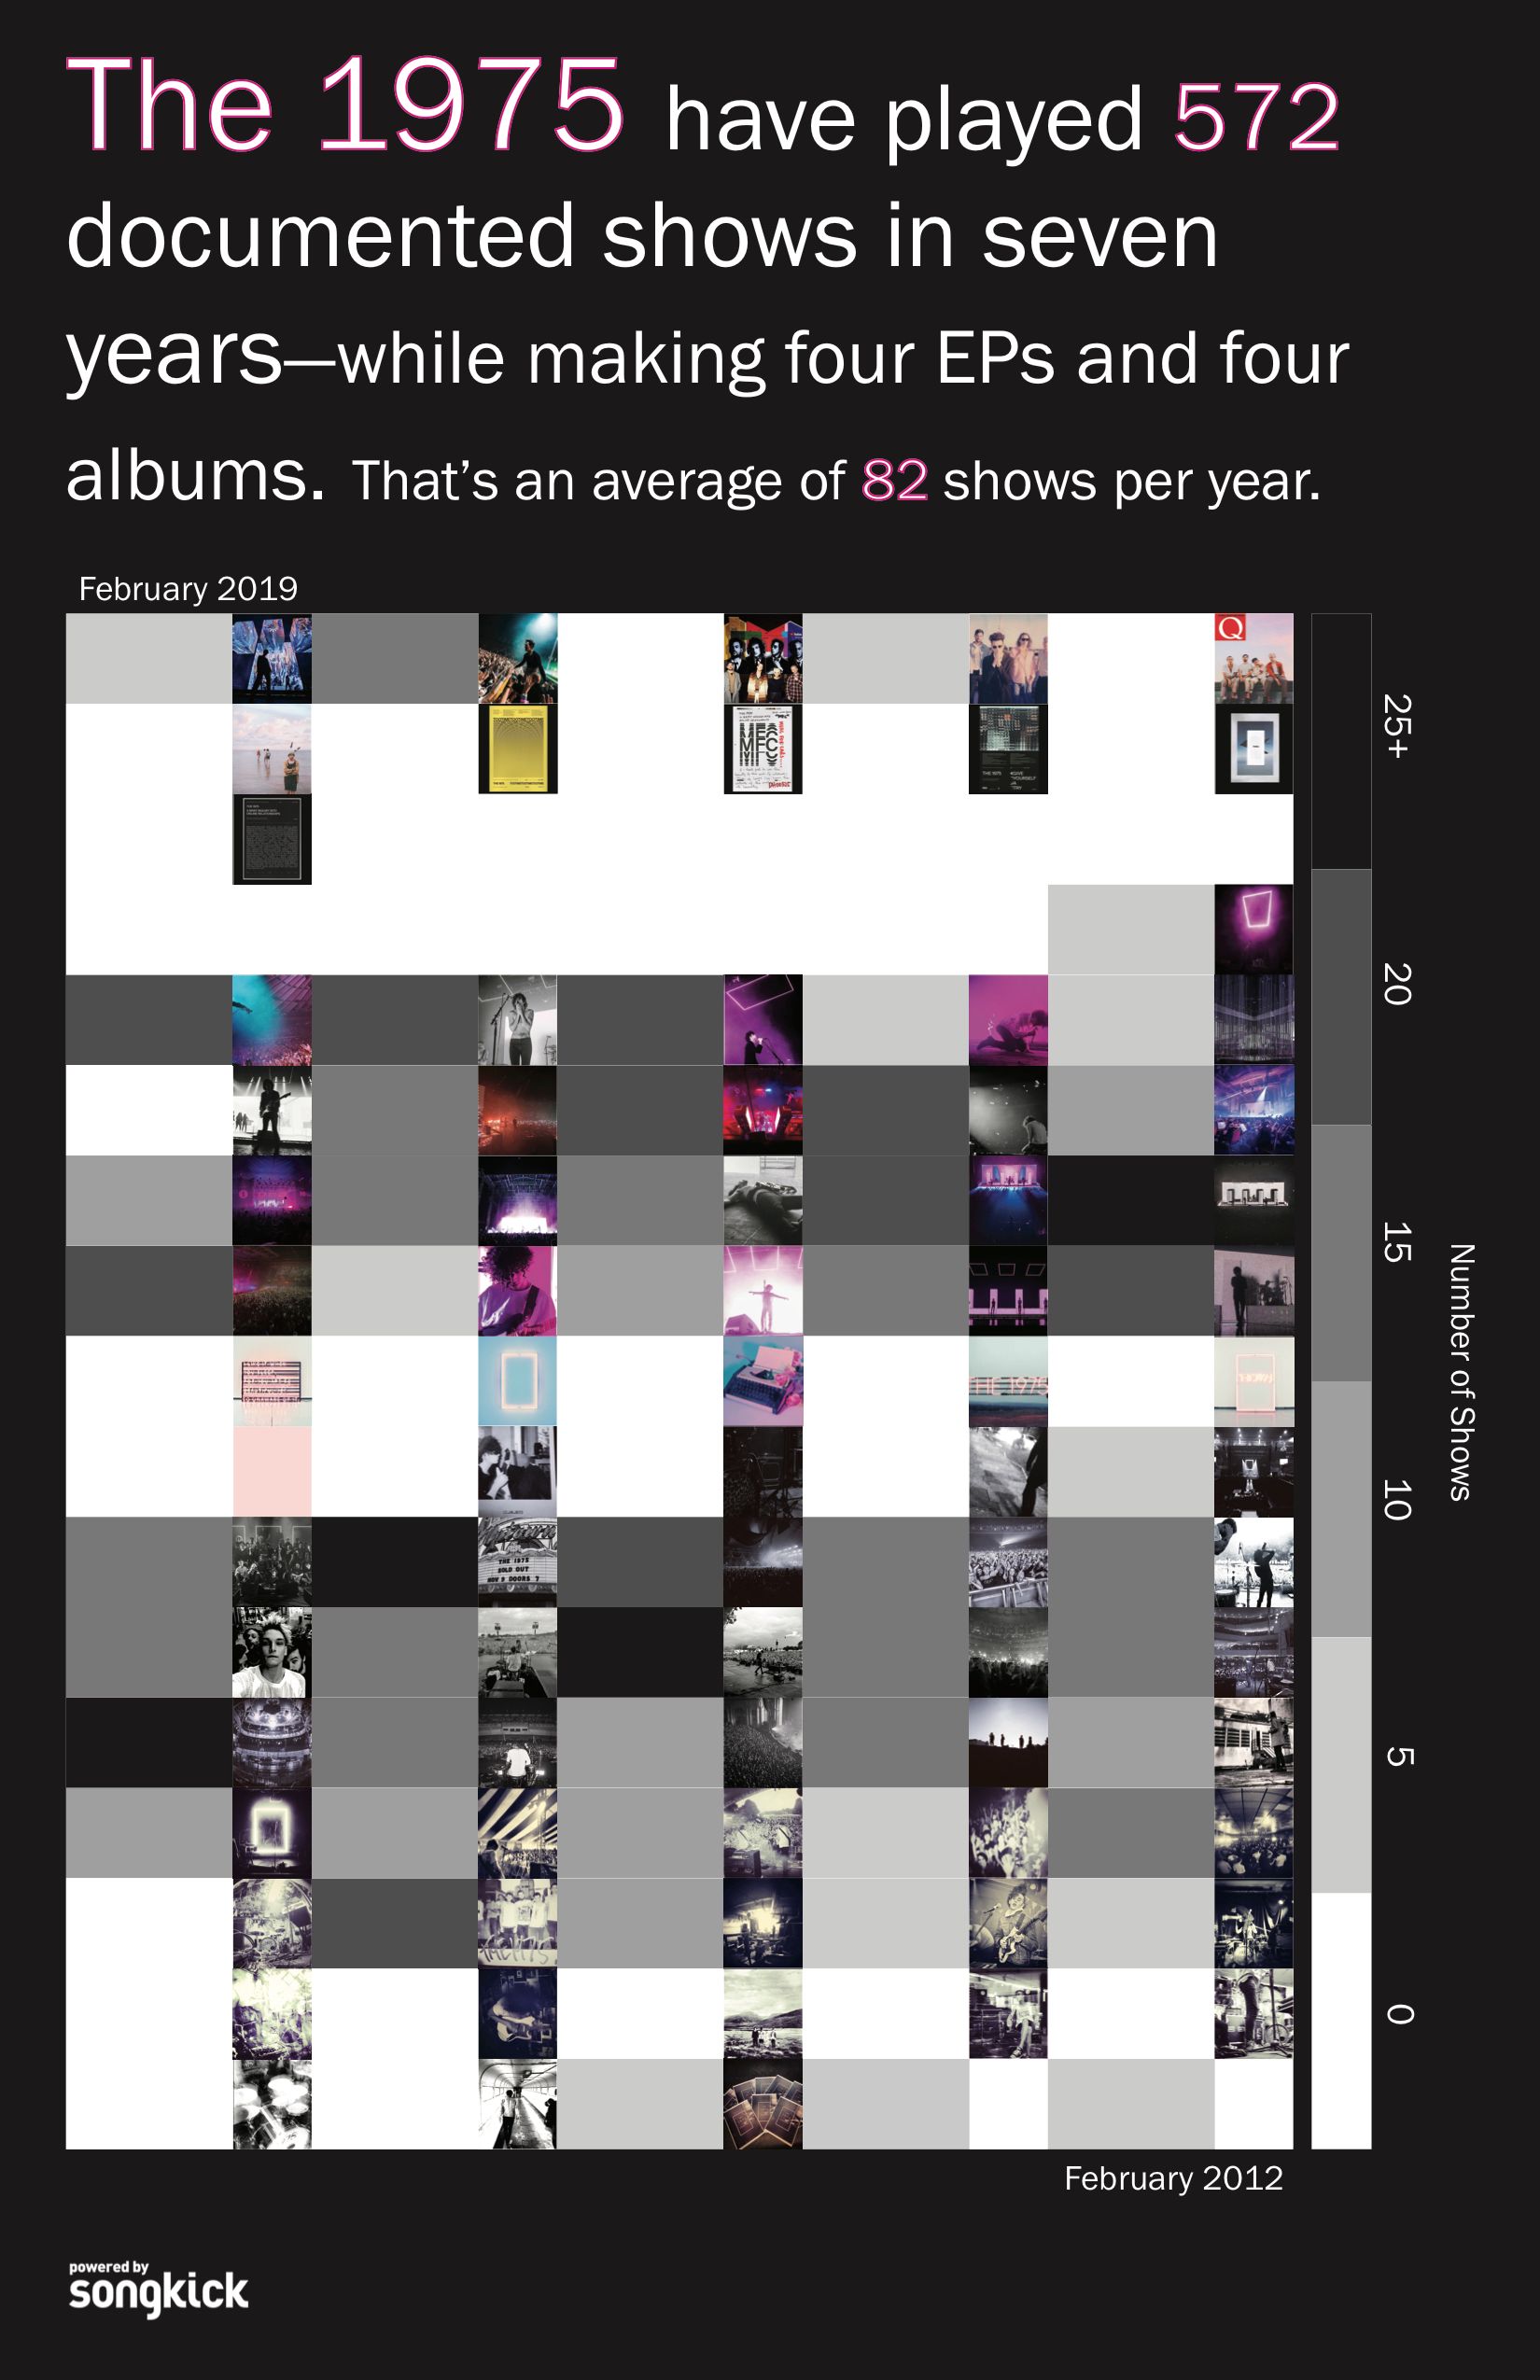
my final design is a calendar heat map of the number of shows the 1975 played each month. next to each month's box is an instagram photo from that month. the darker the box, the more shows the band played that month.
the data is still the songkick data i pulled and cleaned for previous iterations. the instagram photos are also still from the band's instagram. the poster was done in illustrator.