I had several different datasets I was working with last week, but decided to stick with one that I used for my qualitative visualization, to explore what it could provide a bit more. The dataset comes from the Geocognition Research Laboratory, which has documented all public instances of sexual misconduct and violation of relationship policies by academics in this database. These are the two preliminary graphs that I combined and added additional information to:
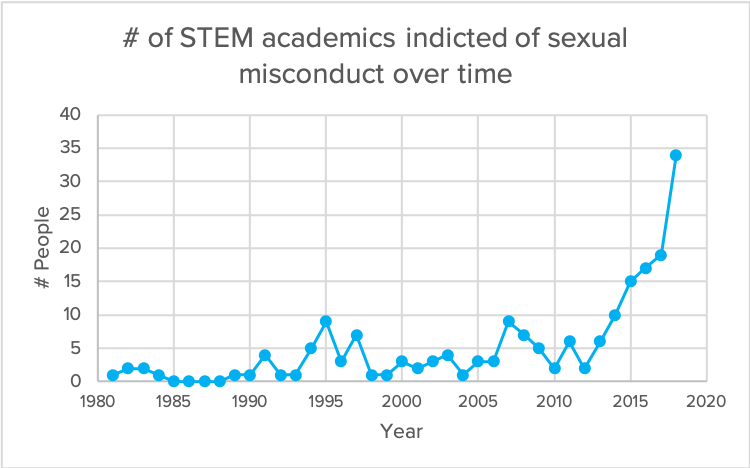
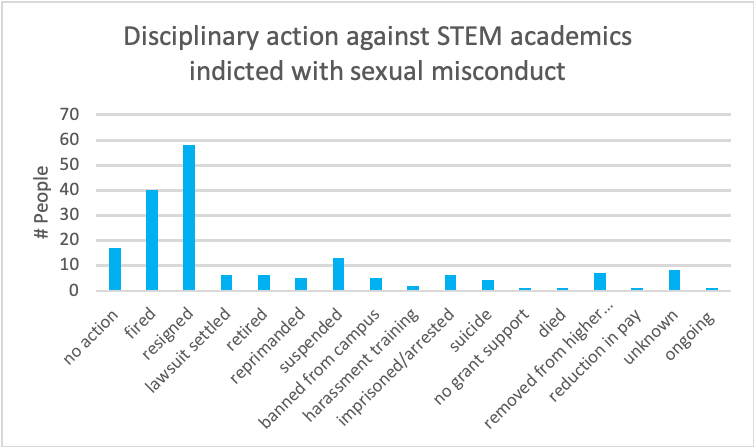
Purely exploratory in nature, I wanted to see if there were any pattern differences between reports of sexual misconduct in STEM vs non-STEM fields, and what the pattern of disciplinary action against STEM academics looked like. This required going through the whole database (755) and manually placing them in STEM and non-STEM categories. I also went through manually to produce summaries of the outcomes listed (these are listed as sentences; I needed to shorten them into phrases, and also combines some similar outcomes for the sake of producing cleaner data). I used pivot tables to get the numbers of the different outcomes each year. I made two charts separately in Excel, then imported them into Illustrator, where I proceeded to manipulate and make them more aesthetically pleasing.
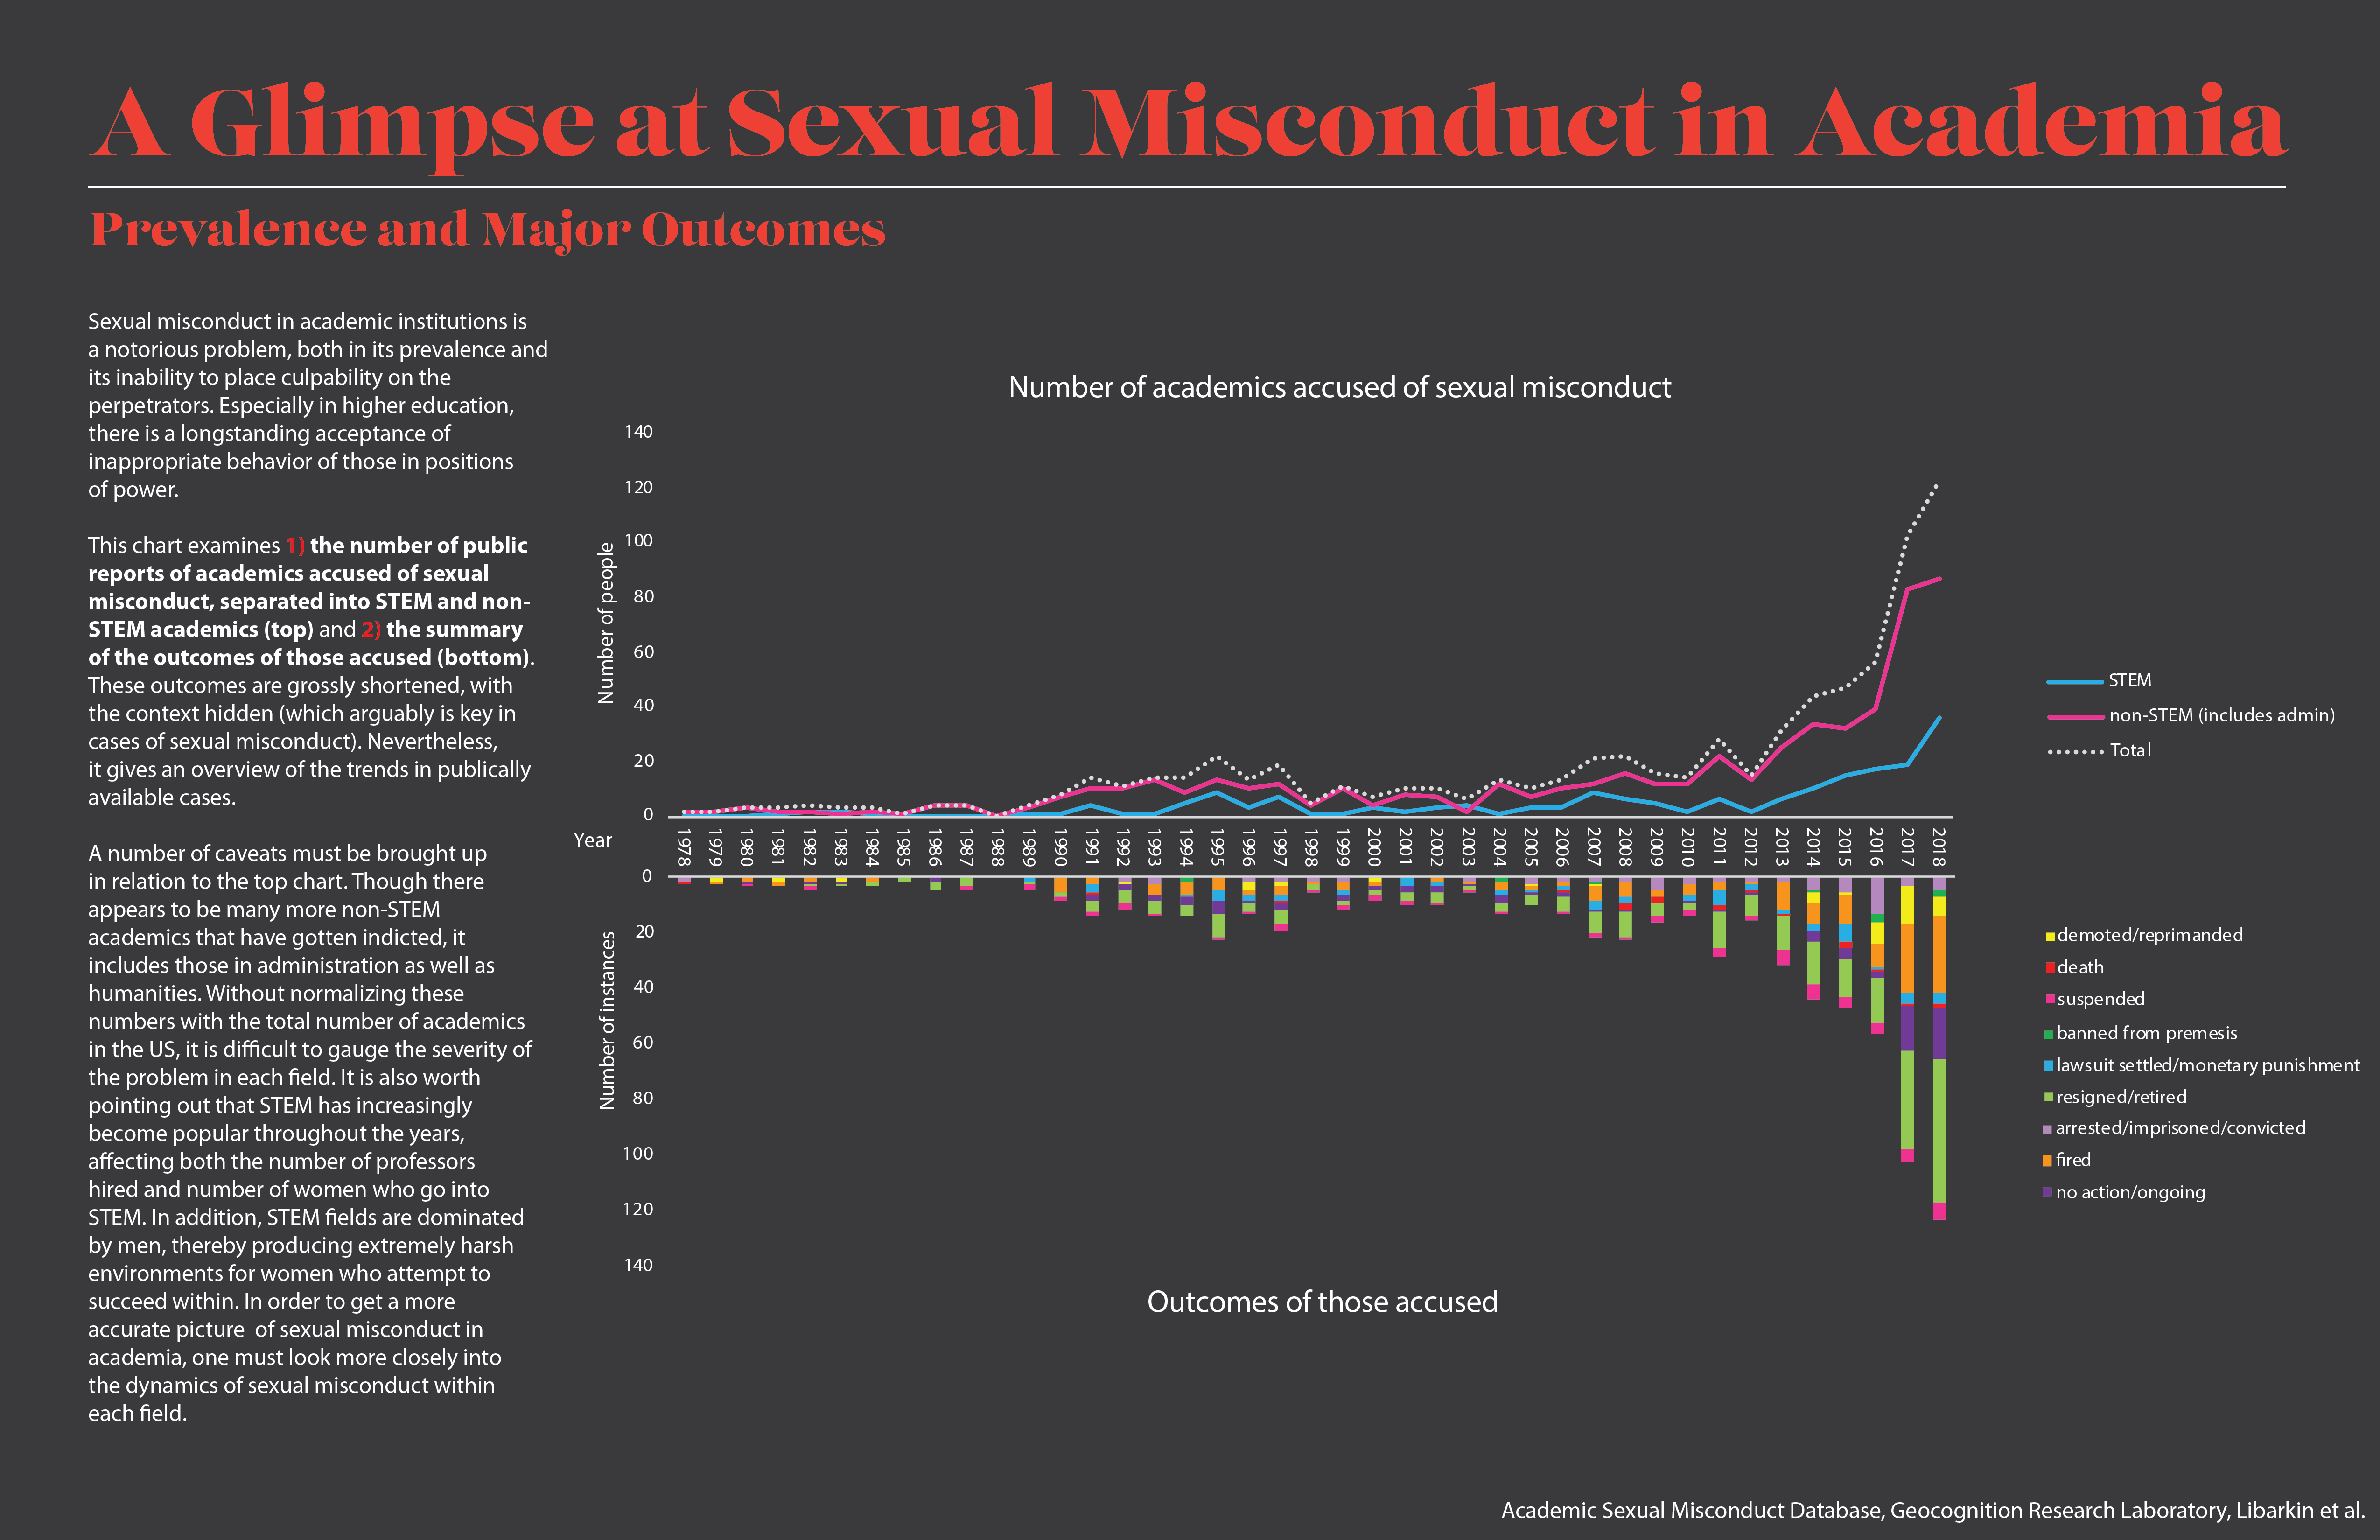
The chart examines 1) the number of public reports of academics accused of sexual misconduct, separated into STEM and non-STEM academics (top) and 2) the summary of the outcomes of those accused (bottom). These outcomes are grossly shortened, with the context hidden (which arguably is key in cases of sexual misconduct). Nevertheless, it gives an overview of the trends in publically available cases.
To be completely honest, I wanted there to be a difference in pattern between STEM and non-STEM, but the nature of the data overlooks many confounding factors that could skew the data. A number of caveats must be brought up in relation to the top chart. Though there appears to be many more non-STEM academics that have gotten indicted, it includes those in administration as well as humanities. Without normalizing these numbers with the total number of academics in STEM and non-STEM fields in the US, it is difficult to gauge the severity of the problem in each field. It is also worth pointing out that STEM has increasingly become popular throughout the years, affecting both the number of professors hired and number of women who go into STEM. In addition, STEM fields are dominated by men, thereby producing extremely harsh environments for women who attempt to succeed within. In order to get a more accurate picture of sexual misconduct in academia, one must look more closely into the dynamics of sexual misconduct within each field.