Data: Schonfeld, Roger, and Sweeney, Liam. Diversity Survey of the New York City Department of Cultural Affairs Grantees, 2015 - on the National Archive of Data on Arts and Culture (NADAC) website https://www.icpsr.umich.edu/icpsrweb/NADAC/ accessed here: https://www.icpsr.umich.edu/icpsrweb/NADAC/studies/36606
Working in aws node here
- Firstly worked with the double bar sets: NYC DCLA museum curators are mainly at the mid or senior job level, recent hiring trends at the mid and senior levels - to investigate why the bar heights did not seem correct. Worked out from Thursday’s d3 class that the bar charts need to all be mapped to the relative max height. Initial visualization depicting NYC museum curatorial staff by race/ethnicity and comparing those numbers to those curatorial staff hired in the 2010s (2010 – 2015 – the survey was fielded in 2015). Bar charts with hover with correct bar lengths and in browser
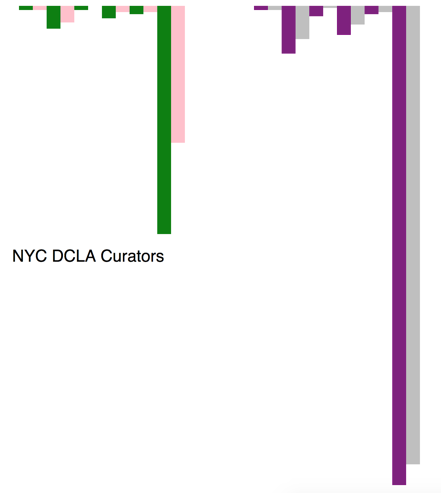
Secondly, used the same data set and switched to the bar chart to compare more recent hiring at NYC museums for all curators and those hired within the past five years. Corrected the relative max height - which has changed what I am seeing here in terms of numbers. Per class feedback, worked in d3 to change this from a bar chart visualization to a line chart to better compare the relative changes.
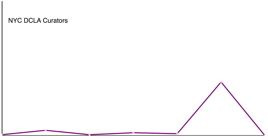
Line chart – first step image above – then needed to pair ‘all curators’ with curators hired in past 5 years by race/ethnicity. To do this, first grouped the data using concat and filter to get 7 paired arrays with all curators and curators hired in the past five years. Used path to draw a line from the left side – all curators – to the right side – number of curators hired since 2010 for each of the 7 race/ethnicity to show the relative numbers of curators by race/ethnicity and hiring trends by race/ethnicity. The codebook for the NYC DCLA data set notes the following race/ethnicities:
1 American Indian or Alaskan Native and Native Hawaiian or Pacific Islander
2 Asian
3 Black or African American
4 Hispanic
5 Two Or More Races
6 White
-8 Declined to State
The survey was fielded in 2015 so the numbers for the 2010s ranges across five years. There are 8,094 staff working in museums, 324 of whom are curators. Of those 324 curators, 135 have been hired since 2010.
The online data visualization is: https://vfs.cloud9.us-east-1.amazonaws.com/vfs/00651c2eccdb449798cec665916ff310/preview/hkMusData/index3simpleline.html
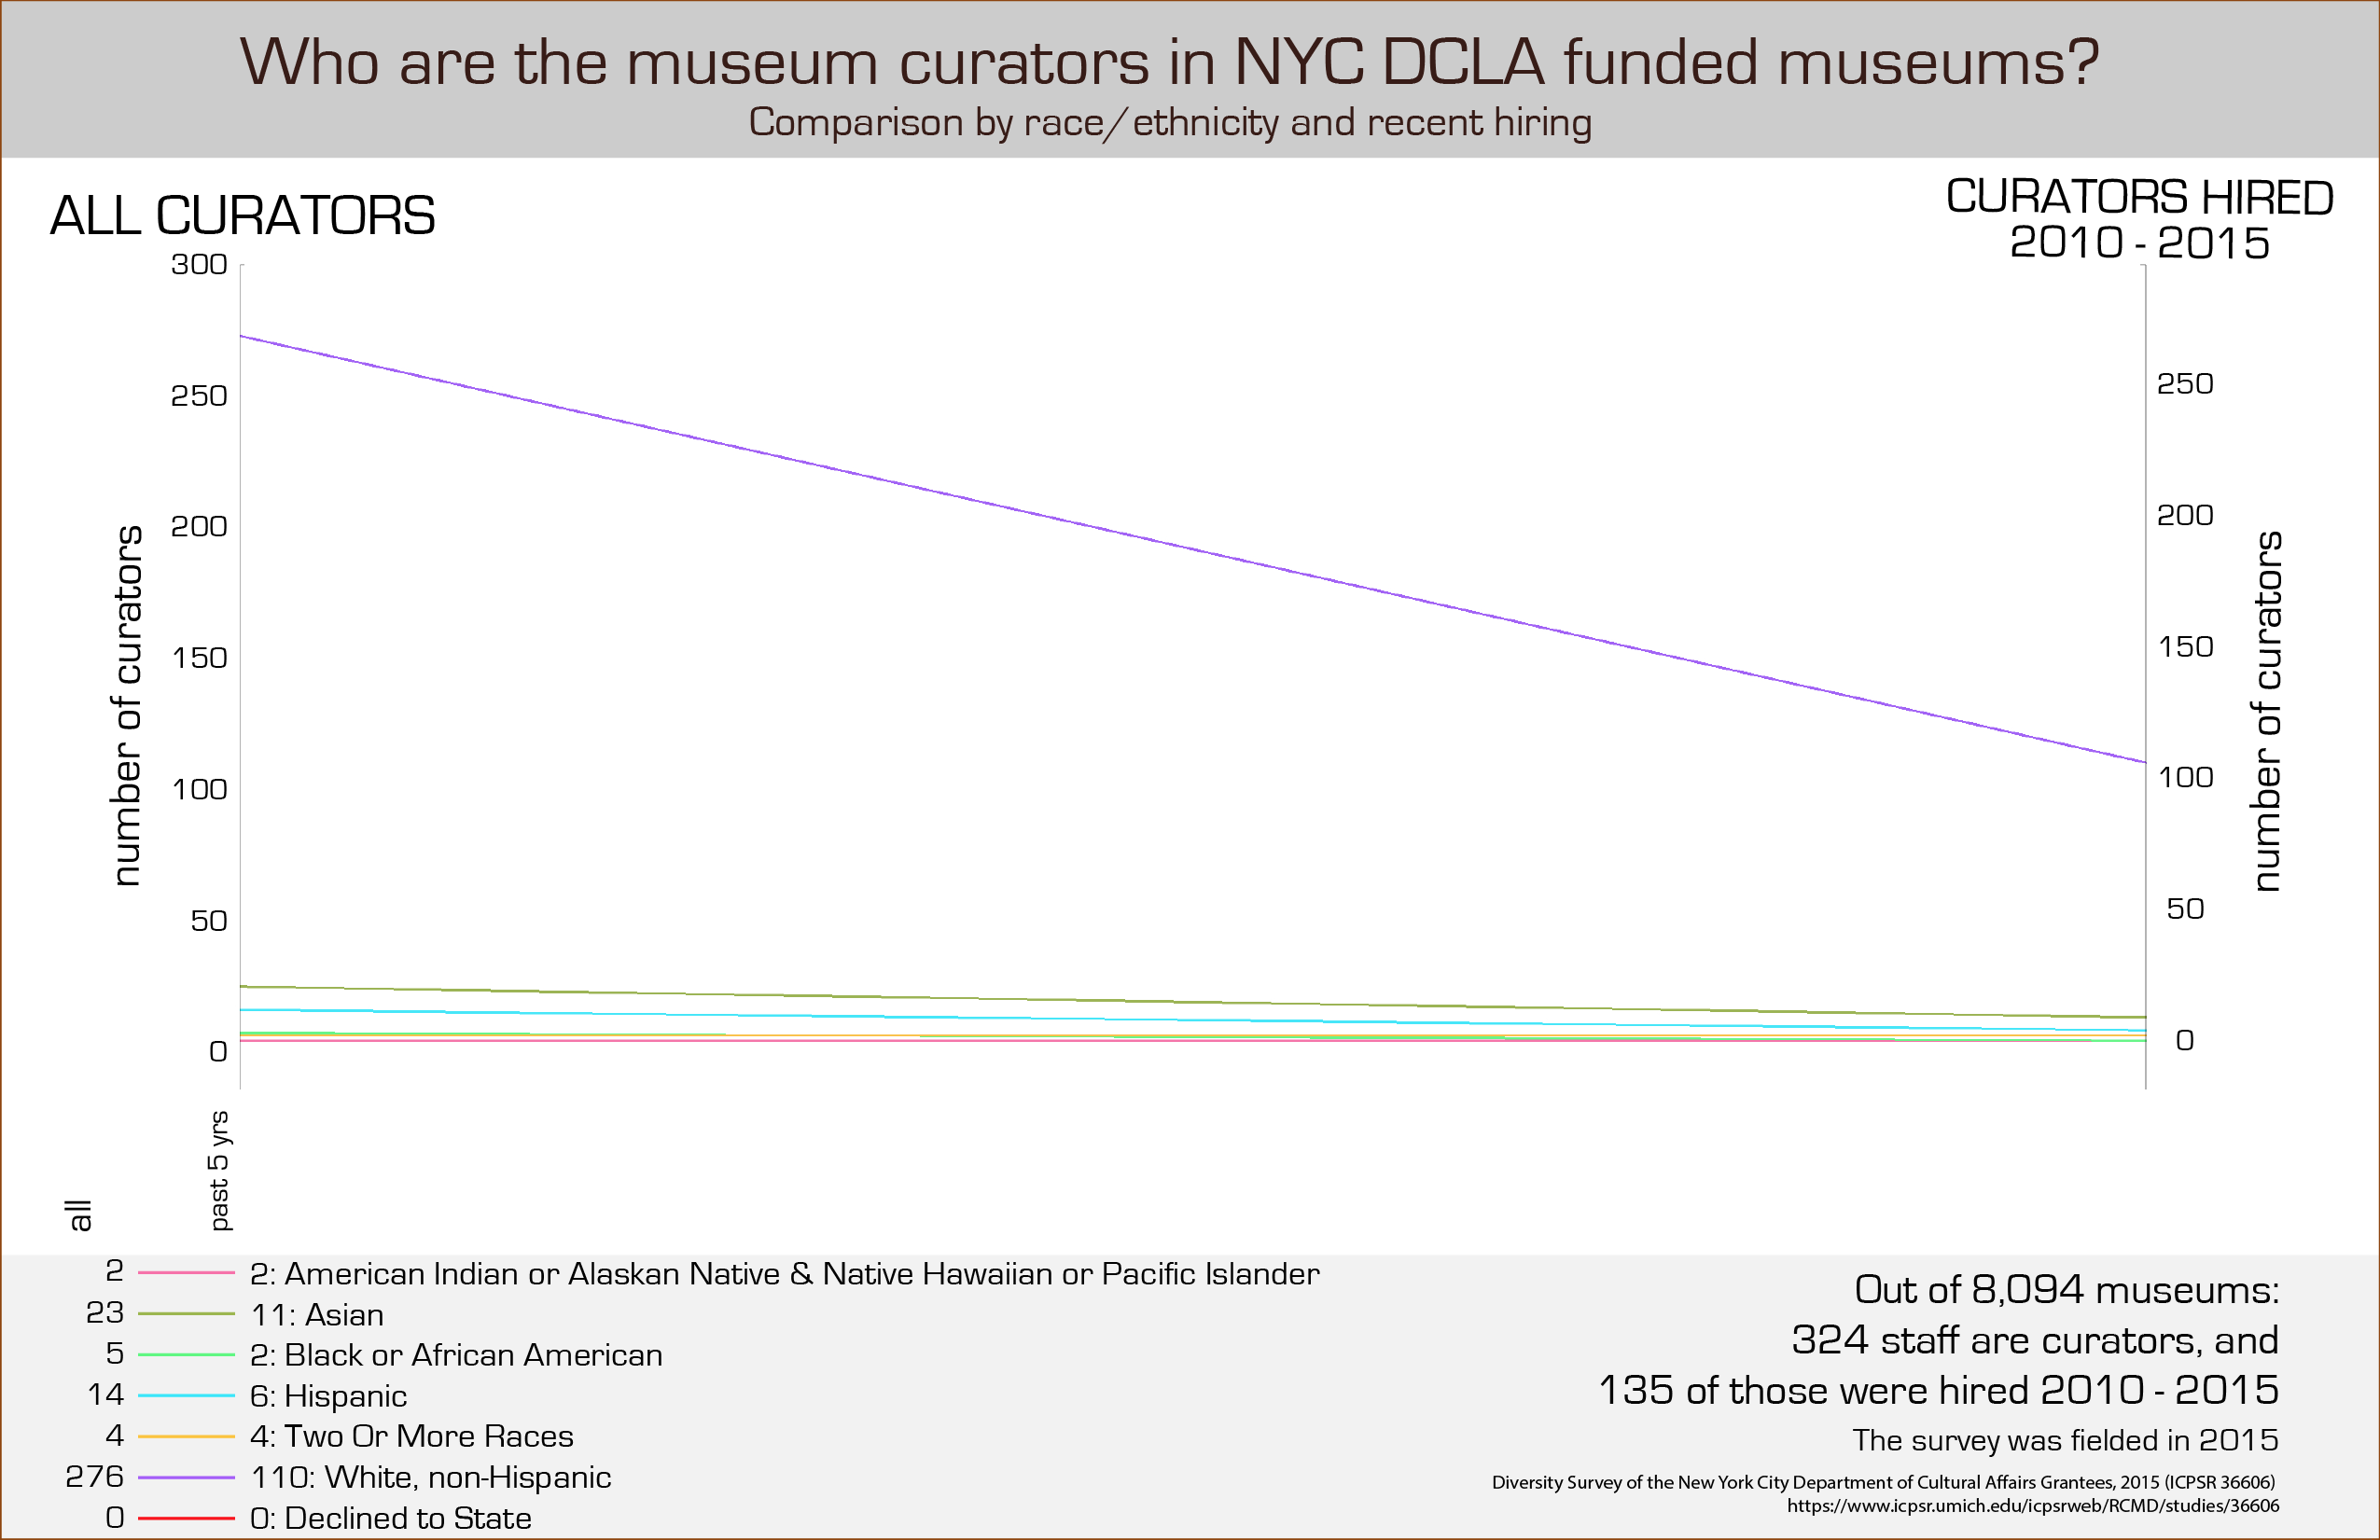
The resulting visualization shows hiring trends in the last five years. The outlier purple line, ‘white non-Hispanic,’ is so much higher at 276 for all curators that it is hard to see what the differences are for say, 5 Black or African American curators – so I decided to include the numbers in the legend to give the exact information. I’d suggest that a ‘close-up’ of the lower part of the chart would be a useful addition here, or a series of individual bar charts - small multiples - for each race/ethnicity so that the trends and numbers can be seen more easily.

To do - move to other data columns to compare by budget and investigate the larger museums. Compare this data set with museum collection data that shows who museums are collecting and - if I can acquire the numbers - who museum audiences are.