v a r i a b l e s
- position ✅
- size ✅
- shape ✅
- value ✅
- hue ✅
- orientation ✅
- texture ✅
t u e s d a y
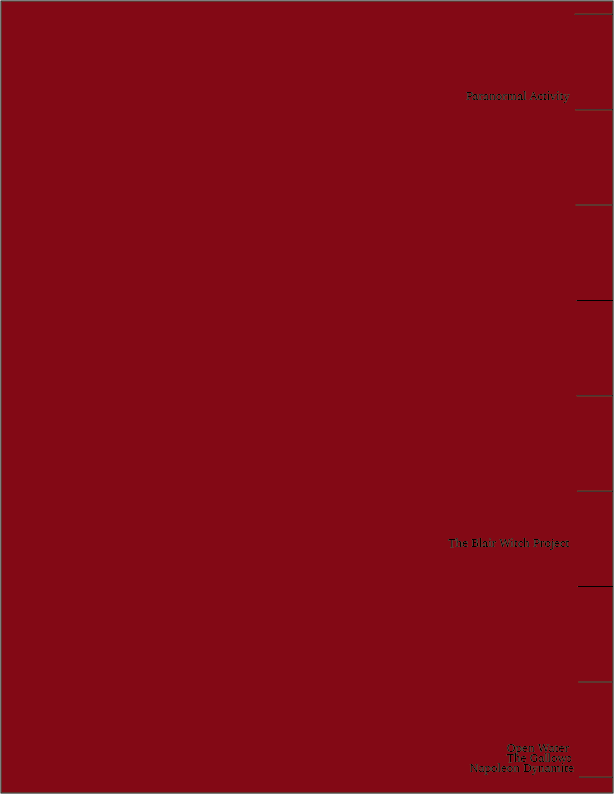
I also wrote down horror movies on a sticky note, and one of my favorite numbers in that realm is 7194/1—how much Paranormal Activity profited, making it the most profitable movie of all time (it took only $15,000 to create). Source. I represented this through the position variable, showing how much higher up on the number line Paranormal Activity is compared to the next five most profitable movies.
m o n d a y
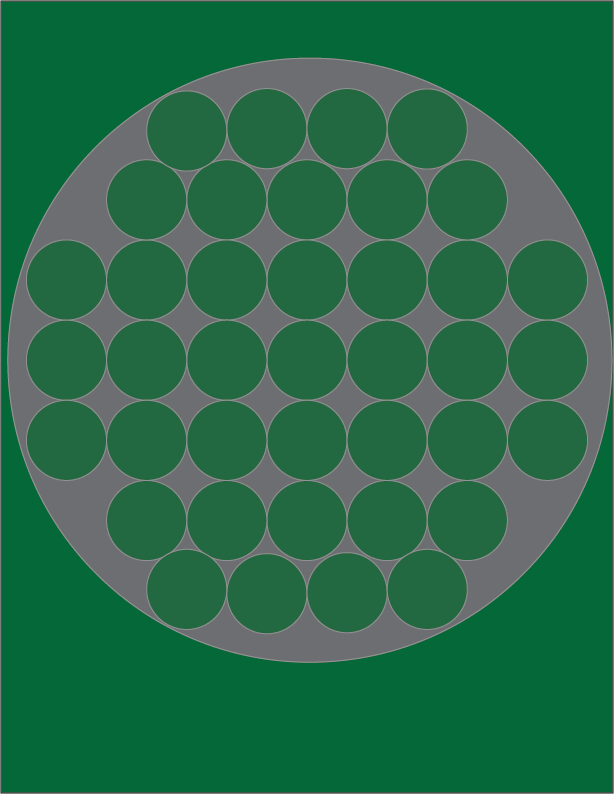
Apparently, the average American throws away 80 pounds of used clothing each year. Source. Thrift clothing was a topic I wrote down on a sticky note, so I decided to represent that number through the size variable, compounding small "80 pound" (80 pixel by 80 pixel) circles adding up to one big circle (aiming to emphasize the problem).
s u n d a y
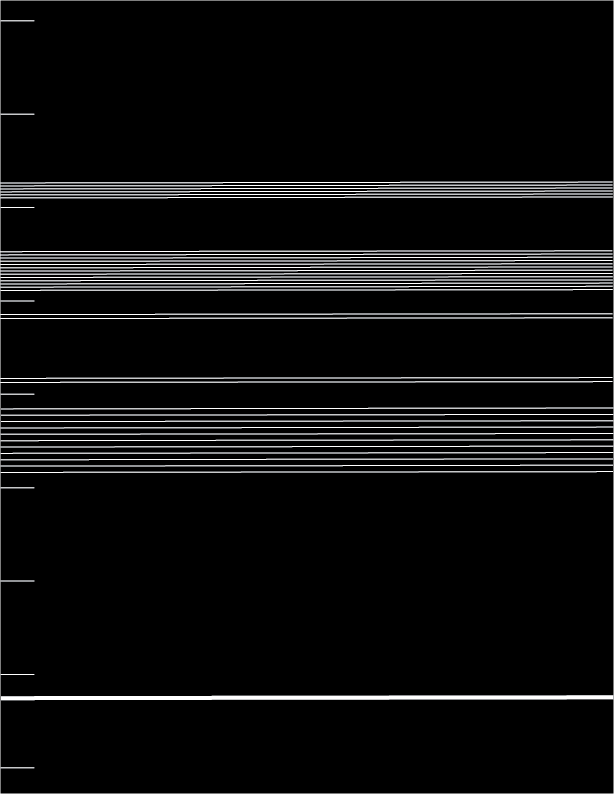
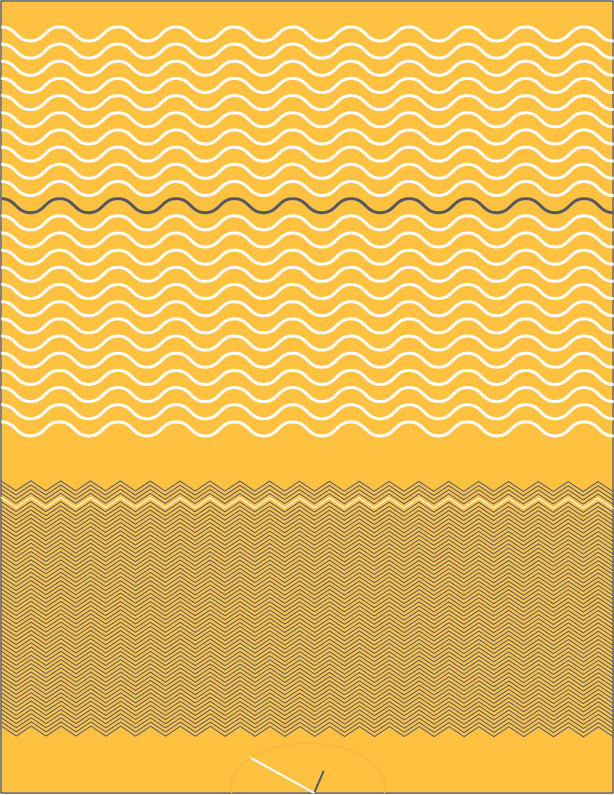
continuing with the topic of touring, a band i like has 33 upcoming concerts. source. i represented this through texture. each date is a line, each section is a month, and the more textured areas translate to clusters of tour dates.
s a t u r d a y
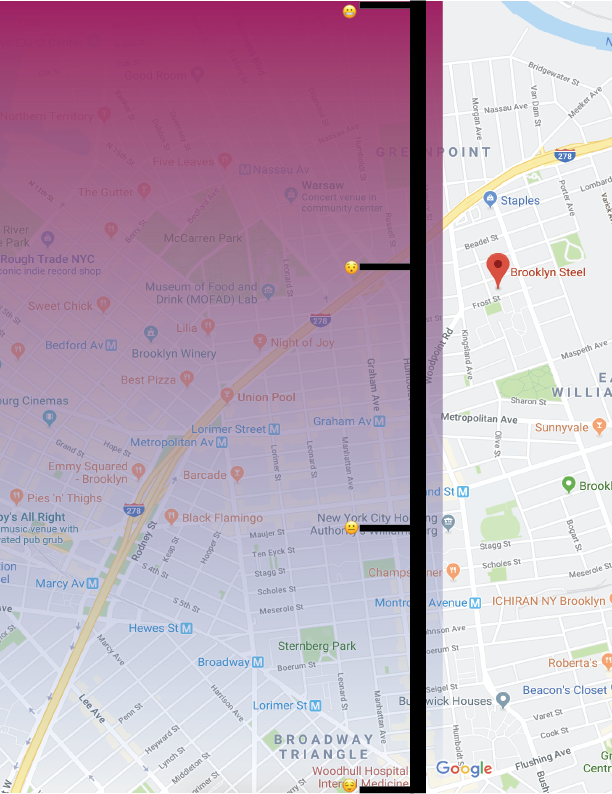
switching to some larger numbers outside of my daily life, one of the areas i'm interested in from a data perspective is touring schedules and venue sizes. brooklyn steel (a venue in east williamsburg) has a capacity of 1,800 people. source. i decided to represent this with the color value retinal variable, through a thermostat-style scale and iconography.
f r i d a y
today, i flew to portland, oregon (this is quickly becoming a diary of my life?). my arrival time was 11:05 am PST. not sure if time as a number was on the table for this assignment, but i've decided to run with it anyway (ask for forgiveness not permission?) because it's a visualization i've recently found intriguing. using inspiration from our first assignment in data viz and info aesthetics last semester, i decided to visualize that time using the color hue retinal variable.
t h u r s d a y
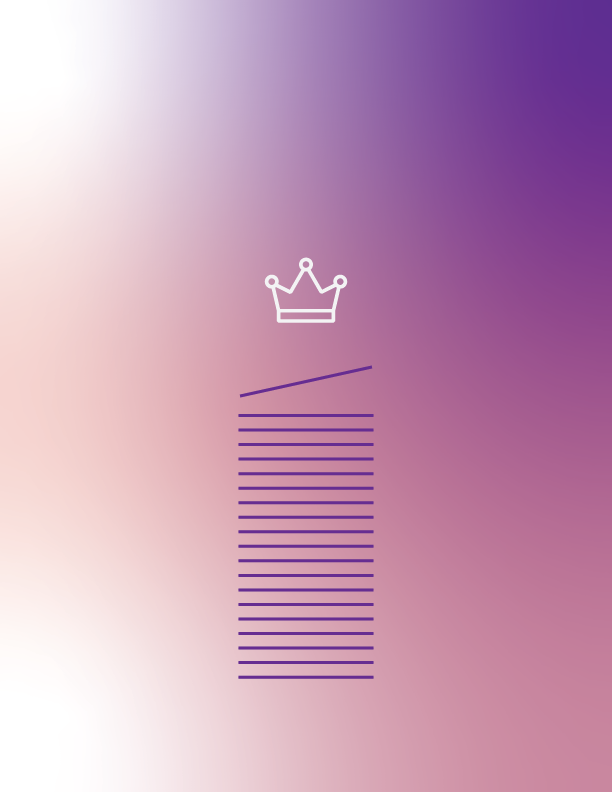
a lot of my ideas usually center on music because it's my favorite type of data to work with. on wednesday night, i saw an artist called king princess in brooklyn. she's arguably one of the most talked about new artists going into 2019 (no. 2 on bbc radio 1's new sounds 2019, slots on basically all the major us festivals this year). she's also just turned 20. i decided to use that number and represent it through orientation for today's poster.
w e d n e s d a y
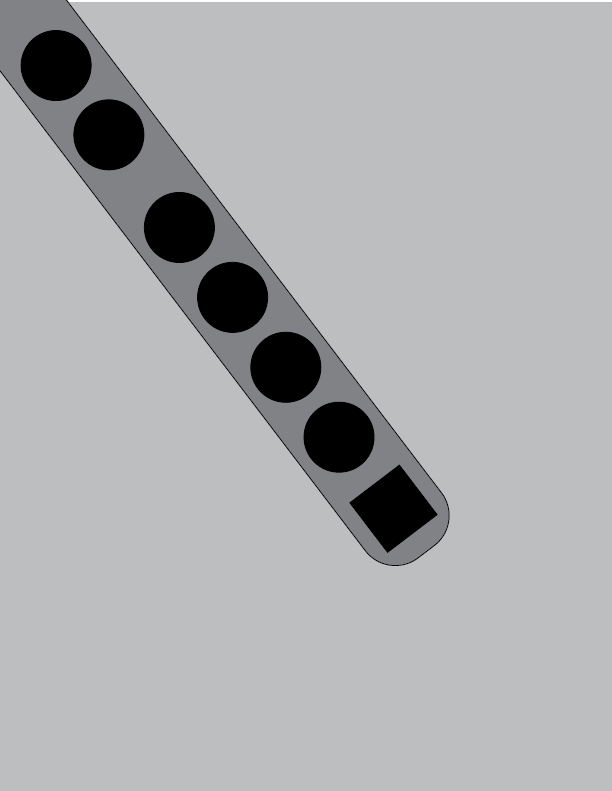
one of the ideas i was interested in during our sticky note exercise was new york city transportation. with that in mind, for the first day of the exercise, i decided to keep it simple and pull a number from my commute. i ride the L train for 7 stops to work. using the retinal variable shape, here's my poster that represents that number, the square being my final destination.